Setting up a S&P collar trade (21:56)

Send a message if you have questions.

1.1) 1983 – 2023 chart
1.2) 10 Year Chart, Monthly Data
1.3) 5 Year Chart, Weekly Data
1.4) 1 Year Chart, Daily Data (ESM23)
1.5) 1 Monthly using 60 minute data (ESM23)


1.6)
Today’s using 5 minute data (ESM23)

1.7) Today’s Technical Opinion (ESM23)
1.8) Ranges & Price Performance (ESM23)
1.9) Support & Resistance (ESM23)
1.10) Barchart Quotes, All Deliveries
1.11) Barchart Options Quotes
1.12) CME Futures Quotes, All Deliveries
1.13) CME Option Quotes

1.14) Contract Specifications each 1.00 = $50.00
1.15) Exchange Margin Requirement
1.16) SP 500 Collar Spreadsheet

2) Educational

2.1) Basics of the Futures
2.2) Basics of Futures Options
2.3) S&P Educational Videos and Links
2.4) Introduction to Order Types
2.5) Detailed Description of Order Types With Examples
2.6) Understanding Futures Margin Requirements
2.7) Understanding Moving Averages
2.8) Understanding Support and Resistance
2.9) About Bollinger Bands & How to Set Them
2.10) Defining Trend, Trade Duration & Number of Contracts Traded
2.11) Explaining Call Options (Short and Long)
2.12) Explaining Put Options (Short and Long)
2.13) Option Collars
2.14) Working Examples of Collaring Positions and Potential Profit/Loss
2.15) 20 year chart of the S&P Priced in Gold
2.16) Test this strategy on any Bull or Bear market from 1983 to 2018
2.17)
Test this strategy on any of these unrelated and unrelated markets
2.18) Quotes, charts and analysis for all 500 stocks
2.19) SEC filings & information for all 500 stocks

3) The Importance of Trading Long and Short (3:23)

 Educational Videos & Resources  Send a Message

3.1) Full Disclosure of trading Methodology
3.2) Bull & Bear Markets
3.3) Excel Spreadsheet 1927-2018 historical data and inflation adjusted
3.4) U.S. Stock Index futures we trade
3.5) European Stock Index futures we trade
3.6) Asian Stock Index Futures
3.7) Why Trade Futures Instead of ETFs?
3.8) A Cost Comparison – Futures versus ETFs
3.9) Top 100 Exchange Traded Funds (ETFs)

# Analysis Pages Hourly 2 hour Daily Weekly Trend
1 S&P 500 Chart Chart Chart Chart Opinion
2 NASDAQ Chart Chart Chart Chart Opinion
3 Dow Chart Chart Chart Chart Opinion
4 Russell 2000 Chart Chart Chart Chart Opinion
5 Euro Stoxx 50 Chart Chart Chart Chart Opinion
6 Euro Stoxx E600 Chart Chart Chart Chart Opinion
7 DAX Index Chart Chart Chart Chart Opinion
8 CAC 40 Chart Chart Chart Chart Opinion
9 Swiss Index Chart Chart Chart Chart Opinion
10 Hang Seng Chart Chart Chart Chart Opinion
11 Nikkei Chart Chart Chart Chart Opinion
12 ASX 200 Index Chart Chart Chart Chart Opinion
13 FTSE 100 Chart Chart Chart Chart Opinion

What we do, my team researches Hedge Funds, CTAs fully disclosed objective long/short trading programs and provides you access to top performers through the safest and most capable firms worldwide. All  trading programs are fully automated through our platform on ChartVPS using CQG integrated client linked to multiple exchange members worldwide

How it works, pick an allocation or, markets/periods you want to traded, we place, monitor, manage all trades 24 hours a day.

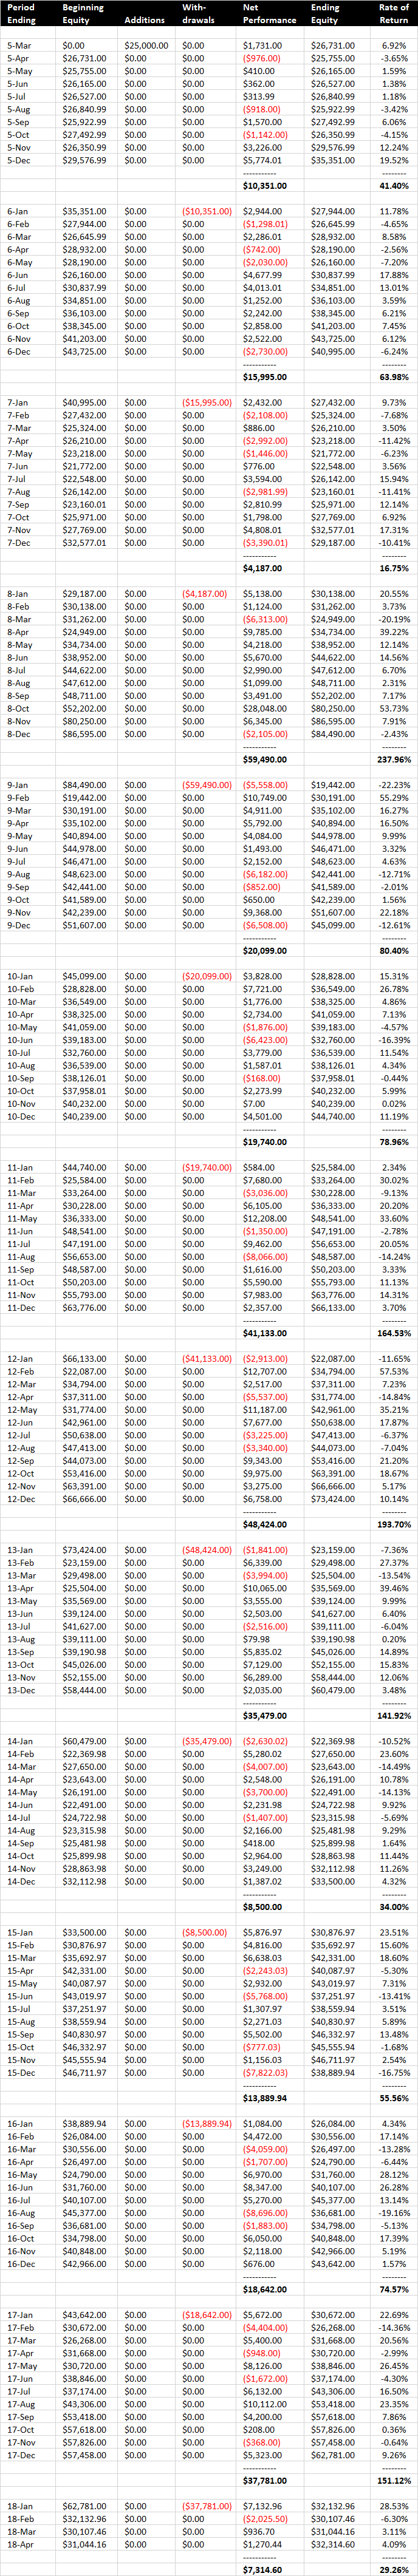
Define your overall account risk, but it should be realistic, in 2023 with the benefit of hindsight, diversification and optimization a capable analyst with access to 6,200 hedge funds, CTA’s and trading programs could optimize performance and produce an allocation where there are no losing months over a 9 year period (allocations 21 & 47 are two). Every market and allocation has a disclosed risk tolerance level please be able to comfortably deal with this risk prior to trading. 

Our fee structure is based on 5.00% to 12.50% of net new high profits quarterly (depends on start balance).

    • 0.00% front load.
    • 0.00% management fee.
    • We pay all server, platform and add on fees.
    • Quarterly incentive fees are approved by the client prior to being deducted.
    • Allocations can be changed at any time.
    • Liquidity 2 to 48 hours in any major currency.
    • Minimums $12,500 to $500,000.

How balances are guaranteed plus or minus trading activity

Every firm we use segregates customer accounts, balances are guaranteed plus of minus trading activity the Financial Safeguard System the FSS has protected customer balances for over 100 years with zero defaults, unlike SPIC that protects balances up to 500,000 or FDIC up to 250,000 the FSS has no limit.

If you have any questions, contact me.

Peter Knight
Voice & Video Chats.
Message me

Disclosure

Trading Interest Rates Higher

If you’d like to answer questions and/or walk you through and of these trades send a message with a date and time or contact me.

1) Trades, Entry Dates, Long-Term and IntraDay charts
___Spread values on the right of the chart
___Click on entry price for the intraday chart

1.1) GEZ19-GEZ23 Entry +0.0500, 27 July 2018, each 0.01 = $100.00
1.2) GEZ19-GEZ22 Entry -0.0350, 17 July 2018, each 0.01 = $100.00
1.3) GEZ18-GEZ22 Entry +0.2900, 15 July 2018, each 0.01 = $100.00
1.4) GEZ18-GEZ21 Entry +0.2650, 13 July 2018, each 0.01 = $100.00
1.5) GEU18-GEZ23 Entry +0.5500, 06 July 2018, each 0.01 = $100.00
1.6) GEU18-GEZ20 Entry +0.3900, 29 May 2018, each 0.01 = $100.00
1.7) GEZ18-GEZ20 Entry +0.3150, 29 May 2018, each 0.01 = $100.00
1.8) ZQZ18 Short 99.1650, 03 Oct 2016, each 0.01 = $41.67
1.9) ZQ quotes all deliveries (Fed Funds contract information)
1.10) GE quotes all deliveries (3 month rate contract information)
1.11) Today’s probability for a rate hike at the next Fed meeting

2) Analysis Pages

2.1) US Rate Analysis
2.2) Euro Rate Analysis

3) 15+ trillion in the face value of open derivatives positions tells us the market’s expectations for hikes through December 2024.

3.1) December 2018
3.2) December 2019
3.3) December 2020
3.4) December 2021
3.5) December 2022
3.6) December 2023
3.7) December 2024

4) Market’s priced in expectation by year between;

4.1) December 2018 to December 2019
4.2) December 2019 to December 2020
4.3) December 2020 to December 2021
4.4) December 2021 to December 2022
4.5) December 2022 to December 2023
4.6) December 2023 to December 2024

5) Latest Fed expectations for rate hikes through December 2020 (2:30)
Full Fed press conference video (52:19) & Opening Statement (PDF)
Next Fed Meeting 25 & 26 September 2018

Educational Links US Rate Analysis Euro Rate Analysis Message Me

6) Fed Funds contract valuation at the Fed’s expectations

0.12% contract value = $500.00 (November 2015)
1.82% contract value = $7,583.21 (11 August 2018)
2.40% December 2018 = $10,000.00
3.10% December 2019 = $12,916.67
3.40% December 2020 = $14,166.67
Each 0.01 = $41.67

7) Fed Funds 1954 – 2018 chart Data & Contract Valuation (excel)

8) Educational Videos and Resources

8.1) Video – About Eurodollar interest rate futures
8.2) What the 3 month rate is (Eurodollar) and how it’s set
8.3) Eurodollar futures pricing and the Forward rate market
8.4) Video – The basics of trading Eurodollar interest rate spreads
8.5) Video – Introduction to Fed Fund futures contracts
8.6) What the Fed funds rate is and how it’s set
8.7) Today’s probability for a rate hike at the next Fed meeting
8.8) Interest rate 3 month to 30 year curve
8.9) Fed Meetings and Press Conferences
8.10) Understanding the FOMC Report
8.11) All Rate Educational Videos & Resources
8.12)
Futures Educational Videos (33)

8.13) Futures Options Educational Videos (34)

9) Previous Rate Reports and Articles 2015 – 2018

9.1) US Economy by the numbers 2000 – 2018 4 June 2018
9.2) Trading Rates Higher & Fed Expectations 28 November 2017
9.3) Trading the Fed Funds rate higher 13 March 2017
9.4) Trade update 11 August 2016 through 20 January 2017
9.5) Trading Rates Higher & Fed Expectations 20 January 2017
9.6) Update Seeking Alpha 13 January 2017
9.7) Market Versus Fed For Rates 16 September 2016
9.8) Market Versus Fed Expectations December 2019 4 September 2016
9.9) Update on Seeking Alpha 5 September 2016
9.10) Who’s right the market or the Fed 31 May 2016
9.11) Original positions published on Seeking Alpha 5 November 2015
9.12) Countdown to Higher Rates 9 October 2015
9.13) Trading 3 Month Rates Higher & Fed Expectations 24 September 2015
9.14) What I See On The Horizon 6 August 2015
9.15) Hedging Treasury Risk 3 August 2015
9.16) The Math On Why U.S. Inflation Is “contained” 22 July 2015
9.17) Trading the Fed Funds Rate Higher 23 July 2015
9.18) Trading Rates Higher & Fed Expectations 9 June 2015
9.19) Trading 3 Month Rates Higher & Fed Expectations 27 April 2015
9.20) Trading Rates Higher Using Cost Averaging 24 March 2015
9.21) Market versus Fed expectations 23 March 2015

10) Fed Funds Risk Reward Spreadsheets

10.1) 3 Month Rates March, June December Fed Funds March hedge
10.2) Fed Funds December 2016
10.3) Fed Funds March 2016 S 99.74 (no hedge)
10.4) Fed Funds December 2016 S 99.46 (no hedge) 100K
10.5) Fed Funds December 2016 S 99.46 (no hedge) 10K
10.6) Trading 3 month rates higher through December 2016
10.7) July 2015 25k no hedge

10.8) July 2015 99.83 25K cost average hedge
10.9) July 2015 99.82 25K 87.50 hedge
10.10) July 2015 10K 99.81/99.75 hedge
10.11) Sep 2015 25k cost average hedge

10.12) Oct 2015 25K cost average hedge
10.13) Dec 2015 25K cost average hedge

11) 3 Month Deposit Spreadsheets

11.1) 3 Month Dec 2017 S 99.70 (no hedge)
11.2) 3 Month put weighted vol spread Dec 2017
11.3) 3 Month vol spread Dec 2017
11.4) 3 Month vol bear spread no hedge Dec 2017
11.5) 3 Month GEH-M-Z-201616 Fed Funds ZQ-H16 10.05.2015
11.6) Contract specifications
11.7) 3 Month Hedged Cost Average
11.8) 3 Month Rate September 2015 hedge
11.9) 3 Month Rate December 2015 hedge

12) Other interest markets I trade

12.1) US rate markets we trade
12.2) European interest rates
12.3) Australian Interest rates
12.4) Educational videos and Links

Open An Account

Account minimum $10,000 USD or major currency equivalent

If you have any questions send a message or contact me

Regards,
Peter Knight

—————————————————————-

Privacy Notice

Disclosure

What is ‘Open Interest’

Open interest is the total number of open or outstanding (not closed or delivered) options and/or futures contracts that exist on a given day.

Example quotes page

BREAKING DOWN ‘Open Interest’

For every seller of a futures or option contract, there must also be a buyer of the contract. One seller and one buyer together create one contract. Therefore, the total open interest in the market for a specified futures or option market equals the total number of buyers or the total number of sellers, not the total of both added together.

Open interest of the futures and options markets is sometimes confused with trading volume, but the two terms refer to distinctly different measures. For example, on a day when one trader who already holds 10 option contracts sells those 10 option contracts to a new trader entering the market, the transfer of contracts does not create any change in the open interest figure for that particular option; no new option contracts have been added to the market. However, the sale of the 10 option contracts by the existing option holder to an option buyer does increase the trading volume figure for the day by 10 contracts. The open interest number only changes when a new buyer and seller enter the market, creating a new contract.

The Importance of Open Interest

Open interest is a measure of the flow of money into a futures or options market. Increasing open interest represents new or additional money coming into the market, while decreasing open interest indicates money flowing out of the market. An increase in open interest is typically interpreted as a bullish signal, while decreasing open interest figures are generally interpreted as a bearish sign.

Open interest is also used as a momentum indicator of trend strength. Since rising open interest represents additional money coming into a market, indicating increased interest in the market by investors, it is generally interpreted to be an indication that the existing market trend is gaining momentum and is likely to continue. Conversely, decreasing open interest reflects declining interest on the part of investors and waning momentum, indicating that the existing trend may soon be exhausted, leading to a trend change.

————————————————————-

Privacy Notice

Disclosure

Risk Disclosure

Defining Account Risk

Program availability is dependent on your country of residence and financial status.

The risk of loss in trading any market using leverage, Stocks, ETFs, Mutual Funds, Forex, Futures or any underlying option can be substantial and therefore investors should understand the risks involved in taking any position in any market.

Program availability is dependent on your country of residence and financial status.

You should carefully consider whether trading is suitable for you in light of your circumstances and financial resources.

Investors must assume responsibility for the risks associated with such investments.

Bid/ask spreads, commission, clearing, exchange and regulatory fees will have an adverse impact on the net overall performance of your account. Prior to making a decision to participate in any investment make sure you fully understand the fees associated with trading.

Examples of historic price moves or extreme market conditions are not meant to imply that such moves or conditions are common occurrences.

The information provided in this report contains research, market commentary and trade recommendations.  It should be known that the representatives of our firm may trade for their own accounts or those of others, due to various factors (such as margin requirements, risk factors, trading objectives, trading instructions, trading strategies and other factors) different from the opinions and recommendations found in this report.

Past performance is not necessarily indicative of future performance. No representation is being made that any account will or is likely to achieve future profits or losses similar to those shown.

Hypothetical performance results have many limitations. No representation is being made that any account will or is likely to achieve profits or losses similar to those shown in fact, there are frequently sharp differences between hypothetical performance results and the actual results subsequently achieved by any particular trading program. one of the limitations of hypothetical performance results is that they are generally prepared with the benefit of hindsight.

Privacy Notice

Automated Trading Accounts (ATA’s)

1) Automated Trading Accounts (ATA’s) what they are and how they work  

2) As our ATA Client you maintain control of

  • The market(s) you trade and when
  • The methodologies you trade
  • The level of leverage that suits your risk tolerance
  • The overall risk for your account

3) ATA Team responsibilities include

    • Calculating entries, risk levels and profit objectives
    • Placing all orders and diligently overseeing executions, positions and balance
    • Monitoring total account risk to ensure it is within your defined guidelines
    • Ensuring everything is done correctly and assuming liability if it’s not
    • Answering all your questions on markets and methodologies

4) ATA’s

        • All ATAs use fully disclosed trading methodology
        • All trades with the trend long or short
        • Mark-to-market positions and balance are available at any time
        • Statements disclose positions, liquidating value and any trading activity
        • Monthly statements summarize all activity and end of month balance
        • Liquidity for ATA accounts in portion or all is 2 to 48 hours
        • AIM ATA’s afford you the opportunity to modify markets, units you trade and your overall account risk level at any time
        • Schedule an online review

If you have questions send a message  or contact me

Regards,
Peter Knight Advisor

—————————————————————-

Risk Disclosure

Privacy Notice

Currency Analysis Page (Collar)

1) Currency Programs, Minimums & Homepages

1.1) EUR-CHF Trend Trader 2009-2018 ($12.5K)
1.2) Short-Term Trend Trader (No Collar) 2012-2018 ($25K)
1.3) FX Trend Trader Aggressive (uses collars) 2007-2018 ($25K)
1.4) FX Trend Trader Moderate (uses collars) 2007-2018 ($50K)
1.5) FX Trend Trader Conservative (uses collars) 2007-2018 ($100K)
1.6) TradeView Versus Saxo Quotes

2) Euro-FX – Today’s Technical Opinion Symbol (E6)

2.1)   15 year chart using monthly data
2.2)   7 year chart, monthly Data
2.3)   3 year chart, weekly data
2.4)   1 year chart, weekly data
2.5)  
9 month chart, daily data

2.6)   3 month chart, daily data
2.7)  
5 day chart 60 minute data
2.8)   1 day chart, 10 minute data
2.9)   Today’s Technical Opinion
2.10) Ranges & Price Performance
2.11)Support & Resistance
2.12) Barchart Quotes, All Deliveries
2.13) Barchart Options Quotes
2.14) CME Futures Quotes, All Deliveries
2.15) CME Option Quotes

2.16) Contract Specifications each 0.01 = $12.50
2.17) Exchange Margin Requirement per 125,000 Euro FX
2.18) EUR Collar Spreadsheet

3) British Pound – Today’s Technical Opinion Symbol (B6)

3.1)   15 year chart using monthly data
3.2)   7 year Chart, monthly Data
3.3)   3 year chart, weekly data
3.4)   1 year chart, weekly data
3.5)  
9 month chart, daily data

3.6)   3 month chart, daily data
3.7)  
5 day chart 60 minute data

3.8)   1 day chart, 10 minute data
3.9)   Today’s Technical Opinion
3.10) Ranges & Price Performance
3.11) Support & Resistance
3.12) Barchart Quotes All Deliveries
3.13) Barchart Options Quotes
3.14) CME Futures Quotes All Deliveries

3.15) CME Option Quotes
3.16) Contract Specifications each 0.01 = $6.25
3.17) Exchange Margin Requirement per 62,500 Pounds
3.18) GBP Collar Spreadsheet

4) Japanese Yen – Today’s Technical Opinion Symbol (J6)

4.1)   15 Year chart using monthly data
4.2)   7 Year Chart, monthly Data
4.3)   3 Year chart, weekly data
4.4)   1 year chart, weekly data
4.5)  
9 month chart, daily data

4.6)   3 month chart, daily data
4.7)  
5 day chart, 60 minute data

4.8)   1 day chart, 10 minute data
4.9)   Today’s Technical Opinion
4.10) Ranges & Price Performance
4.11) Support & Resistance
4.12) Barchart Quotes All Deliveries
4.13) Barchart Options Quotes
4.14) CME Futures Quotes All Deliveries
4.15) CME Option Quotes

4.16) Contract Specifications each 0.01 = $12.50
4.17) Exchange Margin Requirement per 12,500,000 Yen
4.18) JPY Collar Spreadsheet

5) Australian Dollar – Today’s Technical Opinion Symbol (A6)

5.1)   15 Year chart using monthly data
5.2)   7 Year Chart, monthly Data
5.3)   3 Year chart, weekly data
5.4)   1 year chart, weekly data
5.5)  
9 month chart, daily data

5.6)   3 month chart, daily data
5.7)   
5 day chart 60 minute data

5.8)   1 day chart, 10 minute data
5.9)   Today’s Technical Opinion
5.10) Ranges & Price Performance
5.11) Support & Resistance
5.12) Barchart Quotes All Deliveries
5.13) Barchart Options Quotes
5.14) CME Futures Quotes All Deliveries
5.15) CME Option Quotes
5.16) Contract Specifications each 0.01 = $10.00
5.17) Exchange Margin Requirement per 100,000 Australian
5.18) AUD Collar Spreadsheet

6) Canadian Dollar – Today’s Technical Opinion Symbol (D6)

6.1)   15 Year chart using monthly data
6.2)   7 Year Chart, monthly Data
6.3)   3 Year chart, weekly data
6.4)   1 year chart, weekly data
6.5)  
9 month chart, daily data

6.6)   3 month chart, daily data
6.7)  
5 day chart 60 minute data

6.8)   1 day chart, 10 minute data
6.9)   Today’s Technical Opinion
6.10) Ranges & Price Performance
6.11) Support & Resistance
6.12) Barchart Quotes All Deliveries
6.13) Barchart Options Quotes
6.14) CME Futures Quotes All Deliveries
6.15) CME Option Quotes
6.16) Contract Specifications each 0.01 = $10.00
6.17) Exchange margin requirement per 100,000 Canadian
6.18) CAD Collar Spreadsheet

7) Swiss Franc – Today’s Technical Opinion Symbol (S6)

7.1)   15 Year chart using monthly data
7.2)   7 Year Chart, monthly Data
7.3)   3 Year chart, weekly data
7.4)   1 year chart, weekly data
7.5)  
9 month chart, daily data

7.6)   3 month chart, daily data
7.7)  
5 day chart 60 minute data

7.8)   1 day chart, 10 minute data
7.9)   Today’s Technical Opinion
7.10) Ranges & Price Performance
7.11) Support & Resistance
7.12) Barchart Quotes All Deliveries
7.13) Barchart Options Quotes
7.14) CME Futures Quotes All Deliveries
7.15) CME Option Quotes

7.16) Contract Specifications each 0.01 = $12.50
7.17) Exchange Margin Requirement per 125,000 Swiss

8) USD Index Technical Opinion Symbol (DX)

8.1)   15 Year chart using monthly data
8.2)   7 Year Chart, monthly Data
8.3)   3 Year chart, weekly data
8.4)   1 year chart, weekly data
8.5)   9 month chart, daily data
8.6)   3 month chart, daily data
8.7)   5 day chart 60 minute data
8.8)   1 day chart, 10 minute data
8.9)   Today’s Technical Opinion
8.10) Ranges & Price Performance
8.11) Support & Resistance
8.12) Barchart Quotes All Deliveries
8.13) Barchart Options Quotes

9) Major Curencies Priced In USD/Gold

9.1) Gold GBP
9.2) Gold USD
9.3) Gold EUR
9.4) Gold CAD
9.5) Gold JPY
9.6) Gold AUD
9.7) Gold CHF

10) Program Structure and Account Opening Procedure

10.1) (ATA’s), What They Are and How They Work
10.2) The Fee Structure For This Program
10.3) Defining Overall Risk For Your Account
10.4) How Balances Are Guaranteed Plus or Minus Trading
10.5) How To Open An Account

If you have questions send a message or contact me.

Regards,
Peter Knight

—————————————————————-

Privacy Notice

Disclosure


Currency ATA 2007 through 2018 (20180509)

Analysis Page Educational Videos & Resources

Performance dates 8 January 2007 through 30 April 2018

Recommended Starting Balance $50,000.00
Cumulative Net Profit
$907,516.71
Maximum Drawdown (50.14%)
($25,068.18)
Best Year 2008 +345.99% $172,992.93
Worst Year 2007 +33.11% $16,555.80
2007-2018 Average +160.15% $80,075.01
2018 +103.69%
$51,842.65

1) Disclosure of Trading Methodology (26:33)

Send a message if you have any questions.

1.1 ) Option Collars
1.2) Working Examples of Collaring Positions
1.3) 7 year Euro Currency chart, monthly, no analysis
1.4) About Bollinger Bands
1.5) Understanding Moving Averages

1.6) 7 year Euro Currency analysis chart, monthly Data
1.7) Technical Opinion (12 secondary indicators)
1.8) Euro Currency March 2015 to June 2015 daily data
1.9) Explaining Call Options (Short and Long)
1.10) Explaining Put Options (Short and Long)

2) Euro-FX – Today’s Technical Opinion Symbol (E6)

2.1)   15 year chart using monthly data
2.2)   7 year chart, monthly Data
2.3)   3 year chart, weekly data
2.4)   1 year chart, weekly data
2.5)  
9 month chart, daily data

2.6)   3 month chart, daily data
2.7)  
5 day chart 60 minute data
2.8)   1 day chart, 10 minute data
2.9)   Today’s Technical Opinion
2.10) Ranges & Price Performance
2.11) Support & Resistance
2.12) Barchart Quotes, All Deliveries
2.13) Barchart Options Quotes
2.14) CME Futures Quotes, All Deliveries
2.15) CME Option Quotes

2.16) Contract Specifications each 0.01 = $12.50
2.17) Exchange Margin Requirement per 125,000 Euro FX
2.18) EUR Collar Spreadsheet

3) British Pound – Today’s Technical Opinion Symbol (B6)

3.1)   15 year chart using monthly data
3.2)   7 year Chart, monthly Data
3.3)   3 year chart, weekly data
3.4)   1 year chart, weekly data
3.5)  
9 month chart, daily data

3.6)   3 month chart, daily data
3.7)  
5 day chart 60 minute data

3.8)   1 day chart, 10 minute data
3.9)   Today’s Technical Opinion
3.10) Ranges & Price Performance
3.11) Support & Resistance
3.12) Barchart Quotes All Deliveries
3.13) Barchart Options Quotes
3.14) CME Futures Quotes All Deliveries

3.15) CME Option Quotes
3.16) Contract Specifications each 0.01 = $6.25
3.17) Exchange Margin Requirement per 62,500 Pounds
3.18) GBP Collar Spreadsheet

4) Japanese Yen Today’s Technical Opinion Symbol (J6)

4.1)   15 Year chart using monthly data
4.2)   7 Year Chart, monthly Data
4.3)   3 Year chart, weekly data
4.4)   1 year chart, weekly data
4.5)  
9 month chart, daily data

4.6)   3 month chart, daily data
4.7)  
5 day chart, 60 minute data

4.8)   1 day chart, 10 minute data
4.9)   Today’s Technical Opinion
4.10) Ranges & Price Performance
4.11) Support & Resistance
4.12) Barchart Quotes All Deliveries
4.13) Barchart Options Quotes
4.14) CME Futures Quotes All Deliveries
4.15) CME Option Quotes

4.16) Contract Specifications each 0.01 = $12.50
4.17) Exchange Margin Requirement per 12,500,000 Yen
4.18) JPY Collar Spreadsheet

5) Australian Dollar Today’s Technical Opinion Symbol (A6)

5.1)   15 Year chart using monthly data
5.2)   7 Year Chart, monthly Data
5.3)   3 Year chart, weekly data
5.4)   1 year chart, weekly data
5.5)  
9 month chart, daily data

5.6)   3 month chart, daily data
5.7)  
5 day chart 60 minute data

5.8)   1 day chart, 10 minute data
5.9)   Today’s Technical Opinion
5.10) Ranges & Price Performance
5.11) Support & Resistance
5.12) Barchart Quotes All Deliveries
5.13) Barchart Options Quotes
5.14) CME Futures Quotes All Deliveries
5.15) CME Option Quotes
5.16) Contract Specifications each 0.01 = $10.00
5.17) Exchange Margin Requirement per 100,000 Australian
5.18) AUD Collar Spreadsheet

6) Canadian Dollar Today’s Technical Opinion Symbol (D6)

6.1)   15 Year chart using monthly data
6.2)   7 Year Chart, monthly Data
6.3)   3 Year chart, weekly data
6.4)   1 year chart, weekly data
6.5)  
9 month chart, daily data

6.6)   3 month chart, daily data
6.7)  
5 day chart 60 minute data

6.8)   1 day chart, 10 minute data
6.9)   Today’s Technical Opinion
6.10) Ranges & Price Performance
6.11) Support & Resistance
6.12) Barchart Quotes All Deliveries
6.13) Barchart Options Quotes
6.14) CME Futures Quotes All Deliveries
6.15) CME Option Quotes
6.16) Contract Specifications each 0.01 = $10.00
6.17) Exchange margin requirement per 100,000 Canadian
6.18) CAD Collar Spreadsheet

7) Swiss Franc Today’s Technical Opinion Symbol (S6) (not traded)

7.1)   15 Year chart using monthly data
7.2)   7 Year Chart, monthly Data
7.3)   3 Year chart, weekly data
7.4)   1 year chart, weekly data
7.5)  
9 month chart, daily data

7.6)   3 month chart, daily data
7.7)  
5 day chart 60 minute data

7.8)   1 day chart, 10 minute data
7.9)   Today’s Technical Opinion
7.10) Ranges & Price Performance
7.11) Support & Resistance
7.12) Barchart Quotes All Deliveries
7.13) Barchart Options Quotes
7.14) CME Futures Quotes All Deliveries
7.15) CME Option Quotes

7.16) Contract Specifications each 0.01 = $12.50
7.17) Exchange Margin Requirement per 125,000 Swiss

8) Program Structure and Account Opening Procedure

8.1) (ATA’s), What They Are and How They Work
8.2) The Fee Structure For This Program
8.3) Defining Overall Risk For Your Account
8.4) How Balances Are Guaranteed Plus or Minus Trading
8.5) How To Open An Account

9) Educational Resources

9.1)   Basics of the Futures Markets
9.2)   Basics of Futures Options
9.3)   Fundamentals and FX Futures
9.4)   Trading the FX Markets
9.5)   Australian Dollar Futures
9.6)   British Pound Futures
9.7)   Canadian Dollar Futures
9.8)   Japanese Yen Futures
9.9)   Euro FX Futures
9.10) Introduction to Order Types

9.11) Detailed Description of Order Types With Examples
9.12) Understanding Futures Margin Requirements
9.13) Understanding Moving Averages
9.14) About Bollinger Bands & How to Set Them
9.15)
Understanding Support and Resistance

9.16) Defining Trend, Trade Duration & Number of Contracts Traded
9.17) Explaining Call Options (Short and Long)
9.18) Explaining Put Options (Short and Long)
9.19) Option Collars
9.20) Working Examples of Collaring Positions
9.21) What is the European Central Bank?
9.22) Understanding FX Quote Conventions
9.23) FX Futures Pricing and Basis
9.24) Understanding the FX Delivery & Settlement Process
9.25) Hedging FX Risk
9.26) A Look at FX Exchange For Physical (EFP)
9.27) FX Spot Markets vs. Currency Futures
9.28)
Test this strategy on any of these 17 related and unrelated markets

10) Major Curencies Priced In Gold

10.1) Gold GBP +334.23%
10.2) Gold USD +279.19%
10.3) Gold EUR +254.05%
10.4) Gold CAD +238.55%
10.5) Gold JPY +232.03%
10.6) Gold AUD +214.54%9
10.7) Gold CHF +177.12%

11) United States Fundamentals 2003 – 2018

11.1)   US Median Income +4.4%
11.2)   US Median Income Paid In Gold -71.46%
11.3)   Official US Consumer Price Index +37.34%
11.4)   Median Home Price +70.92%
11.5)   Mortgage Debt +41.89%
11.6)   Median Rent +54.20%
11.7)   Grocery PPI +64.40%
11.8)   Consumer Healthcare +87.40%
11.9)   Federal Health Care Expenditures Per Capita +168.65%
11.10) Federal Pension Expenditures Per Capita +90.94%
11.11) Federal Social Insurance Taxes +47.18%
11.12) Federal Spending Per Capita +70.54
11.13) Federal Revenue Per Capita +62.30%
11.14) Federal Debt +202.10%
11.15) US Debt Service Cost +44.03%
11.16) Balance of trade -8.52 Trillion USD
11.17) Gold USD +279.19%
11.18) The S&P priced in gold 23.86%

11.19) The Only Solution To The US Debt Crisis

12) Other Markets Traded Using This Strategy

12.1) U.S. Futures markets
12.2) European Futures markets
12.3) Any stock in the S&P 500 with options liquidity

12.4) Any of the top 100 performing stocks with options liquidity

If you have questions send us a message or contact us

—————————————————————-

Privacy Notice

Disclosure


Gold Bull and Bear 1979 though 2018

January 1979 $224.10 to January 1980 $873.00 = + 289.56% (using Daily data)
January 1980 $873.00 to June 1982 $301.00 = – 65.52% (using weekly data)
June 1982 $301.00 to February 1983 $514.00 = +41.44%
(using daily data)
February 1983 $514.00 to March 1985 $290.10 = -43.56% (using weekly data)
March 1985$290.10 to December 1987 $479.80 = +39.33% (using weekly data)

December 1987 $479.80 to September 1989 $365.20
= -23.88% (using daily data)


Gold ATA Performance 2005-2018

Introduction (6:23)

Analysis Page   Educational Videos   Metals (19)    Futures (58)   Options (34)

Performance 1 March 2005 through 30 April 2018

Recommended Starting Balance $25,000.00
Cumulative Net Profit
$341,025.25
Maximum Drawdown (49.10%)
($12,276.00)
Best Year 2008 +237.96% $59,490.00
Worst Year 2007 +16.75% $4,187.00
2005-2018 Average +103.60% $25,900.67
2018 +29.26%
$7,314.60

About Performance

Monthly and Annual Performance

Disclosure

1) Full Disclosure of what we’re trading and how (21:09)

1) Gold Symbol (GC)

1.1)   20 Year chart using monthly data
1.2)   10 Year Chart, monthly Data
1.3)   3 Year chart, weekly data
1.4)   9 month chart, daily data
1.5)   10 day chart 60 minute data (notify us here if you can’t access)
1.6)   Today’s using 5 minute data  (notify us here if you can’t access)
1.7)   Today’s Technical Opinion 
1.8)   Ranges & Price Performance 
1.9)   Support & Resistance
1.10) Barchart Quotes, All Deliveries 
1.11) Barchart Options Quotes
1.12) CME Futures Quotes, All Deliveries
1.13) CME Option Quotes

1.14) Contract Specifications  each 1.00 = $100.00
1.15) Exchange Margin Requirement
1.16) Metals Analysis Page

2) Educational

2.1)   Basics of the Futures Markets
2.2)   Basics of Futures Options
2.3)   Gold Futures Video
2.4)   Gold Educational Videos and Links
2.5)   Introduction to Order Types
2.6)   Detailed Description of Order Types With Examples
2.7)   Understanding Futures Margin Requirements
2.8)   Understanding Moving Averages
2.9)   Understanding Support and Resistance
2.10) About Bollinger Bands & How to Set Them
2.11) Defining Trend, Trade Duration & Number of Contracts Traded
2.12) Explaining Call Options (Short and Long)
2.13) Explaining Put Options (Short and Long)
2.14) Option Collars
2.15) Working Examples of Collaring Positions and Potential Profit/Loss
2.16) 20 year chart of the S&P Priced in Gold
2.17) Test this strategy on any of these 17 related and unrelated markets

3) Program Structure and Account Opening Procedure

3.1) (ATA’s), What They Are and How They Work
3.2) The Fee Structure For This Program
3.3) Defining Overall Risk For Your Account Before the First Trade Goes On
3.4) How Balances Are Guaranteed Plus or Minus Trading Activity
3.5)
How To Open An Account

4) Primary Metals Exchanges

4.1) Chicago Mercantile Exchange/Comex
4.2) Additional Gold trading Information From the CME

5) Other Markets Traded Using This Strategy

5.1) U.S. Futures markets
5.2) European Futures markets
5.3) Any stock in the S&P 500 with options liquidity

5.4) Any of the top 100 performing stocks with options liquidity 

6) May 2003 to May 2018 (online review reference links)

Gold priced in major currencies
6.1)  Gold GBP +334.23%
6.2)  Gold USD +279.19%
6.3)  Gold EUR +254.05%
6.4)  Gold CAD +238.55%
6.5)  Gold JPY  +232.03%
6.6)  Gold AUD +214.54%
6.7)  Gold CHF +177.12%

Stock Indices
6.8)   Dax +298.11% priced in EUR
6.9)   S&P +176.53% priced USD
6.10) FTSE 100 +91.96% priced in GBP
6.11) Euro Stoxx 50 +50.09% priced in EUR

Energy Prices in USD
6.12) New York Heating Oil +186.67%
6.13) New York Crude Oil +137.93%
6.14) Gasoline +73.13%

7) United States Fundamentals 2003 – 2018

4.1) US Median Income +4.4%
4.2) US Median Income Paid In Gold  -71.46%
4.3) Official US Consumer Price Index +37.34%
4.4) Median Home Price +70.92%
4.5) Mortgage Debt +41.89%
4.6)  Median Rent +54.20%
4.7)  Grocery PPI +64.40%
4.8)  Consumer Healthcare +87.40%
4.9)  Federal Health Care Expenditures Per Capita +168.65%
4.10) Federal Pension Expenditures Per Capita +90.94%
4.11) Federal Social Insurance Taxes +47.18%
4.12) Federal Spending Per Capita +70.54
4.13) Federal Revenue Per Capita +62.30%
4.14) Federal Debt +202.10%
4.15) US Debt Service Cost +44.03%
4.16) Balance of trade  -8.52 Trillion USD
4.17) Gold USD +279.19%
4.18) The S&P priced in gold  23.86%
4.19) The Only Solution To The US Debt Crisis

If you have questions send us a message  or contact us

Regards,
Peter Knight Advisor

—————————————————————-

Privacy Notice

Disclosure


Automated Trading Accounts (ATA’s) what they are and how they work

Gold ATA Performance Homepage

1) About This ATA

2.1) As our ATA Client you maintain control of

  • The market(s) you trade and when
  • The methodologies you trade
  • The level of leverage that suits your risk tolerance
  • The overall risk for your account

2.2) ATA Team responsibilities include

  • Calculating entries, trade risk levels and profit objectives
  • Placing all orders and diligently overseeing executions, positions and balance
  • Monitoring total account risk to ensure it is within your defined guidelines
  • Ensuring everything is done correctly and assuming liability if it’s not
  • Answering all your questions on markets and methodologies

2.3) About this ATA

  • This ATA uses fully disclosed trading methodology
  • Trades with the trend long or short
  • Uses option collars that define risk on every trade and duration of every trading period
  • Trades in this ATA cannot be stopped out regardless of market volatility
  • The only way a position can be called away is at a profit
  • If the market stays the same this ATA hasn’t wasted precious investment capital on purchasing option time premium as it is collecting approximately as much  time premium on the covered writes (at the profit objectives), as it’s paying out on the purchased options that define maximum trade risk
  • Option collars can be offset at any time locking in gains and/or modified to capture more of the move or, reversed to capture a trend reversal
  • Mark-to-market positions and balance are available online at any time
  • Statements are emailed daily disclosing positions, liquidating value and any trading activity
  • Monthly statements summarize all activity and end of month balance
  • Liquidity for ATA accounts in portion or all is 2 to 48 hours in any major currency
  • AIM ATA’s afford you the opportunity to modify markets, units you trade and your overall account risk level at any time
  • Other markets we trade ATA’s on in North America and Europe
  • Contact us with your questions
  • Schedule an online review

If you have questions send us a message or  schedule an online review.

———————————————————

Privacy Notice

Disclosure