
Introduction (6:23)
Analysis Page Educational Videos Metals (19) Futures (58) Options (34)
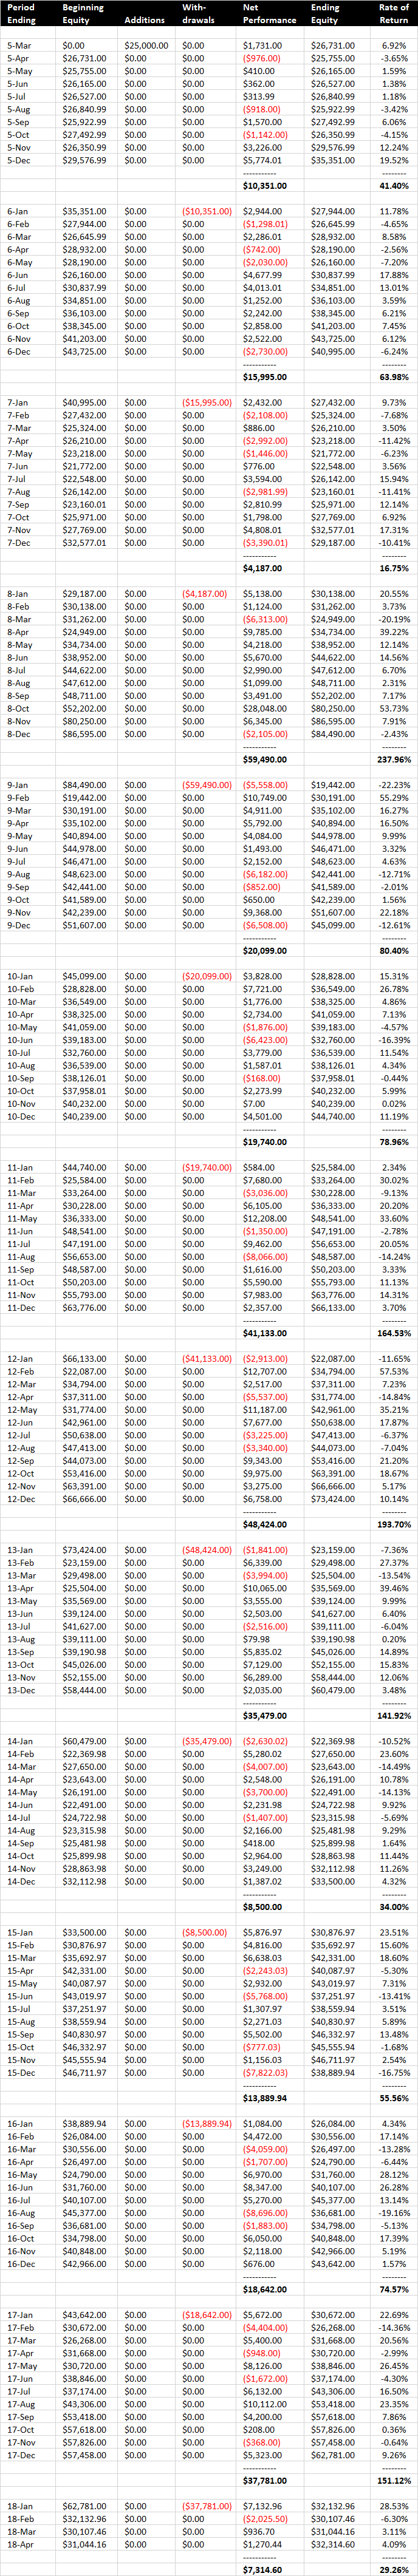
Performance 1 March 2005 through 30 April 2018
| Recommended Starting Balance | $25,000.00 |
| Cumulative Net Profit |
$341,025.25 |
| Maximum Drawdown (49.10%) |
($12,276.00) |
| Best Year 2008 +237.96% | $59,490.00 |
| Worst Year 2007 +16.75% | $4,187.00 |
| 2005-2018 Average +103.60% | $25,900.67 |
| 2018 +29.26% |
$7,314.60 |
About Performance
Monthly and Annual Performance
1) Full Disclosure of what we’re trading and how (21:09)
1) Gold Symbol (GC)
1.1) 20 Year chart using monthly data
1.2) 10 Year Chart, monthly Data
1.3) 3 Year chart, weekly data
1.4) 9 month chart, daily data
1.5) 10 day chart 60 minute data (notify us here if you can’t access)
1.6) Today’s using 5 minute data (notify us here if you can’t access)
1.7) Today’s Technical Opinion
1.8) Ranges & Price Performance
1.9) Support & Resistance
1.10) Barchart Quotes, All Deliveries
1.11) Barchart Options Quotes
1.12) CME Futures Quotes, All Deliveries
1.13) CME Option Quotes
1.14) Contract Specifications each 1.00 = $100.00
1.15) Exchange Margin Requirement
1.16) Metals Analysis Page
2) Educational
2.1) Basics of the Futures Markets
2.2) Basics of Futures Options
2.3) Gold Futures Video
2.4) Gold Educational Videos and Links
2.5) Introduction to Order Types
2.6) Detailed Description of Order Types With Examples
2.7) Understanding Futures Margin Requirements
2.8) Understanding Moving Averages
2.9) Understanding Support and Resistance
2.10) About Bollinger Bands & How to Set Them
2.11) Defining Trend, Trade Duration & Number of Contracts Traded
2.12) Explaining Call Options (Short and Long)
2.13) Explaining Put Options (Short and Long)
2.14) Option Collars
2.15) Working Examples of Collaring Positions and Potential Profit/Loss
2.16) 20 year chart of the S&P Priced in Gold
2.17) Test this strategy on any of these 17 related and unrelated markets
3) Program Structure and Account Opening Procedure
3.1) (ATA’s), What They Are and How They Work
3.2) The Fee Structure For This Program
3.3) Defining Overall Risk For Your Account Before the First Trade Goes On
3.4) How Balances Are Guaranteed Plus or Minus Trading Activity
3.5) How To Open An Account
4) Primary Metals Exchanges
4.1) Chicago Mercantile Exchange/Comex
4.2) Additional Gold trading Information From the CME
5) Other Markets Traded Using This Strategy
5.1) U.S. Futures markets
5.2) European Futures markets
5.3) Any stock in the S&P 500 with options liquidity
5.4) Any of the top 100 performing stocks with options liquidity
6) May 2003 to May 2018 (online review reference links)
Gold priced in major currencies
6.1) Gold GBP +334.23%
6.2) Gold USD +279.19%
6.3) Gold EUR +254.05%
6.4) Gold CAD +238.55%
6.5) Gold JPY +232.03%
6.6) Gold AUD +214.54%
6.7) Gold CHF +177.12%
Stock Indices
6.8) Dax +298.11% priced in EUR
6.9) S&P +176.53% priced USD
6.10) FTSE 100 +91.96% priced in GBP
6.11) Euro Stoxx 50 +50.09% priced in EUR
Energy Prices in USD
6.12) New York Heating Oil +186.67%
6.13) New York Crude Oil +137.93%
6.14) Gasoline +73.13%
7) United States Fundamentals 2003 – 2018
4.1) US Median Income +4.4%
4.2) US Median Income Paid In Gold -71.46%
4.3) Official US Consumer Price Index +37.34%
4.4) Median Home Price +70.92%
4.5) Mortgage Debt +41.89%
4.6) Median Rent +54.20%
4.7) Grocery PPI +64.40%
4.8) Consumer Healthcare +87.40%
4.9) Federal Health Care Expenditures Per Capita +168.65%
4.10) Federal Pension Expenditures Per Capita +90.94%
4.11) Federal Social Insurance Taxes +47.18%
4.12) Federal Spending Per Capita +70.54
4.13) Federal Revenue Per Capita +62.30%
4.14) Federal Debt +202.10%
4.15) US Debt Service Cost +44.03%
4.16) Balance of trade -8.52 Trillion USD
4.17) Gold USD +279.19%
4.18) The S&P priced in gold –23.86%
4.19) The Only Solution To The US Debt Crisis
If you have questions send us a message or contact us
Regards,
Peter Knight Advisor
—————————————————————-