
This program trades up to 5 S&P E-mini contracts per $25,000 trading unit with the trend up or down using defined risk strategy. The Gold ATA and Currency ATA’s use the same methodology.
- Up to 2 short-term positions with a trade duration of 2 to 10 days
- Up to 2 medium-term positions with a trade duration of 11-29 days
- Up to 1 long-term position, trade with a duration of 30 to 90 days
- Total margin requirement never exceeds $12,500 USD per $25,000 USD trading unit because all trades are fully hedged.
1) Trend Identification Procedure (TIP)
1.1) Looking at the 1983 to 2018 chart below and linked here does it really look that hard to identify the major up or downtrends over the last 35 years?

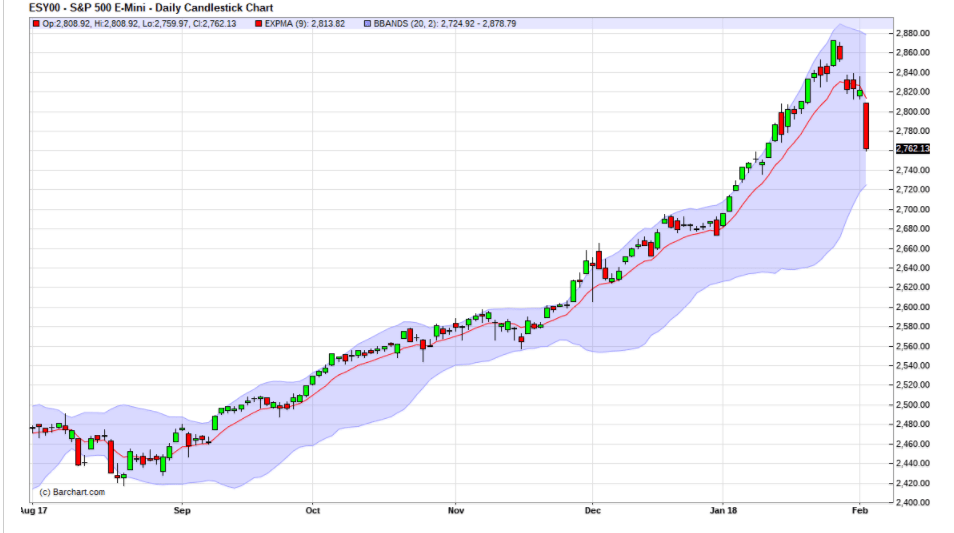
1.2) One quick and reliable indicator out of the 12 this program uses is an Exponential Moving Average 9 (EMA9).
On the 2000 to 2013 chart below and linked here I’ve dropped in an EMA9 represented by the red line.

1.2) Whatever data period you’re using, 3 minutes to 3 months if price action is below the (EMA9) it’s telling you the market is in a downtrend.

1.3) If price action is above the (EMA9) an uptrend

1.4) By itself you’ll find the EMA9 a quick and reliable way to initially qualify a market’s trend.
Below I’ve linked every Bull and Bear market since 1983 enabling you to review the accuracy of the EMA9 as an indicator. These charts should also clarify the need to trade the market both long or short to maximize profitability.
1.5) 1983-2018 chart
1.6) January 1983 – August 1987 Bull 139.72 – 337.89 =+141.83%
1.7) August 1987 – October 1987 Bear 337.89 – 216.47 =-35.94%
1.8) August 1987 – August 1989 Bear to recovery (2 years)
1.9) August 1987 – July 1990 Bull 216.47 – 369.78 = +70.82%
1.10) July 1990 October 1990 Correction 369.78 – 294.51 =-20.36%
1.11) July 1990 – February 1991 Correction to recovery (7 months)
1.12) October 1990 – July 1998 Bull 294.51 – 1,190.58 =+304.26%
1.13) July 1998 – October 1998 Correction 1,190.58 – 923.52 =-22.43%
1.14) July 1998 – November 1998 Correction to recovery (4 months)
1.15) October 1998 – March 2000 Bull 923.52 – 1,552.87 =+68.15%
1.16) March 2000 October 2002 Bear 1,52.87 – 768.63 =-50.50%.
1.17) March 2000 December 2007 Bear to recovery (7 years 9 months)
1.18) October 2002 – October 2007 Bull 768.63 – 1,576.09 =+105.05%
1.19) October 2007 – March 2009 Bear 1,576.09 – 666.79 =-57.70%
1.20) October 2007- April 2013 Bear to recovery (5 years 6 months)
1.21) March 2009 – January 2018 Bull 666.79 – 2,872.87 = +327.87%
2) Once you’ve initially qualified the trend using the EMA9 confirm the trend using the overall average of the indicators linked here.

3) Specific examples
3.1) Short-term trades with a trade duration of 2 to 10 days
In the example below is the daily price action above or below the EMA9?
Above the EMA9 = buy
Below the EMA9 = sell
Below, the short term trend is down
3.3) Confirm the EMA9 short-term trend using the overall average and the short-term technical opinion.
In this example the overall average is a 48% sell
The average of the 5 short-term indicators is a 60% sell
3.4) If the EMA9, overall average and short-term average indicators all agree short-term trades of 2 to 10 days in duration are permitted
Example,
EMA9 = sell
Overall average = 48% sell
5 short-term indicators = 60% sell
If you’re already short the market, short-term trades can be maintained, if you’re long reverse to short.
This program trades up to 2 short-term positions per $25,000 trading unit.
3.5) Short-term, short futures positions with a duration of 2 to 10 days
If the overall average and short-term average indicators are less than a 50% sell you are not permitted to add a second position
Example,
Overall average = 65% sell
5 short-term indicators = 40% sell
Does not permit adding a second contract
If the overall average and short-term average indicators are both greater than a 50% sell you are permitted to add a second position
Example,
Overall average = 53% sell
5 short-term indicators = 60% sell
Permits a second contract
3.6) Short-term, long futures positions with a duration of 2 to 10 days
If the overall average of short-term average indicators are less than a 50% buy you are not permitted to add a second position
Example,
Overall average = 60% buy
5 short-term indicators = 35% buy
Does not permit a second contract
If both the overall average and short-term average indicators are greater than a 50% buy you are permitted to add a second position
Example,
Overall average = 53% buy
5 short-term indicators = greater than 60% buy
Permits a second contract
3.7) If the EMA9, overall-average and short-term average indicators do not agree liquidate to neutral.
Example,
EMA9 using daily data = buy (price action is above the EMA9)
Overall average = 27% Buy
5 short-term indicators = 8% sell
Liquidate
Try to identify today’s short-term trend
3.6) Today’s EMA9 (using daily data)
- Is price action above or below the EMA9?
- Above = BUY
- Below = Sell
3.7) Today’s Technical (Opinion)
- Does the overall average agree with the EMA9?
- Does the average of the 5 short-term indicators agree with the EMA9?
- If they all agree positions are permitted
- If the overall average and short-term indicators are greater than 50% a second position is permitted
- If they disagree liquidate to neutral
3.8) Once trend is defined “collar” the trade, using this procedure.
- Collars objectively define risk on the trade and for the duration of the trading period
- Collars eliminate any possibility of the position being stopped out
- Collars eliminate the possibility of a margin call (because risk is objectively defined when the trade is established)
- In most cases collars reduce your margin requirement, if the maximum risk on the trade is $1,800.00 and the exchange margin requirement is $5,050.00, the margin requirement would be the lower of the 2, in this example the margin requirement would be the maximum trade risk of $1,800.00.
- Properly set up a collar is premium neutral (does not waste investment capital on excessive purchases of option time premium to define risk)
4) Medium-term trades with a duration of 11 to 29 days
4.1) The rules are the same as the short-term but you’re using an EMA9 on weekly price action versus daily

4.2) Confirm the EMA9 medium-term trend using the overall average and medium-term average of technical opinions.
In this example the overall average is a 48% sell
The average of the 5 short-term is a 50% sell

Try to identify today’s medium-term trend
4.3) Today’s EMA9 (using weekly data)
- Is price action above or below the EMA9?
- Above = BUY
- Below = Sell
4.4) Today’s indicators (Opinion)
- Does the overall average agree with the EMA9?
- Does the average of the 4 medium-term indicators agree with the EMA9?
- If they all agree positions are permitted
- If the overall average and medium-term indicators are greater than 50% a second position is permitted
- If they disagree liquidate to neutral
4.5) Once a trend is defined “collar” the trade, using this procedure.
5) Long-term trades with a duration of 30 to 90 days
5.1) The rules are the same as the short-term but you’re using an EMA9 on monthly price action versus daily or weekly.

5.2) Confirm the EMA9 long-term trend using the overall average and long-term Average technical opinions.
In the example below, the overall average was a 48% sell, the long-term indicators are generating a hold, no new long-term trades would be permitted.

5.3) This program trades a maximum of 1 long-term position per $25,000 trading unit.
Try to identify today’s long-term trend
5.4) Today’s EMA9 (using monthly data)
- Is price action above or below the EMA9?
- Above = BUY
- Below = Sell
5.5) Today’s indicators (Opinion)
- Does the overall average agree with the EMA9?
- Does the average of the 3 long-term indicators agree with the EMA9?
- If they all agree positions are permitted
- If they disagree liquidate to neutral
5.6) Once trend is defined collar the trade, using this procedure.
6) To demonstrate the durability of the EMA9 and Opinion try using them on the related and unrelated markets linked below.
6.1) Last 10 EuroStoxx
6.2) Opinion
6.3) Last 10 FTSE 100 monthly O/H/L/C
6.4) FTSE opinion
6.5) Last 10 DAX Index monthly O/H/L/C
6.6) DAX Index opinion
6.7) Last 10 Gold monthly O/H/L/C
6.8) Gold opinion
6.9) Last 10 Euro monthly O/H/L/C
6.10) Euro opinion
6.11) Last 10 British Pound monthly O/H/L/C
6.12) British Pound opinion
6.13) Last 10 Australian dollar monthly O/H/L/C
6.14) Australian Dollar opinion
6.15) Last 10 Canadian dollar monthly O/H/L/C
6.16) Canadian Dollar opinion
6.17) Last 10 Brazilian Real monthly O/H/L/C
6.18) Brazilian Real opinion
6.19) Last 10 Russian Ruble monthly O/H/L/C
6.20) Russian Ruble opinion
6.21) Last 10 on 2 year US Treasuries monthly O/H/L/C
6.22) 10 Year Treasury opinion
6.23) Last 10 Euro Bund monthly O/H/L/C
6.24) Euro Bund opinion
6.25) Last 10 NY Crude Oil monthly O/H/L/C
6.26) Crude Oil opinion
6.27) Last 10 Copper monthly O/H/L/C
6.28) Copper opinion
6.39) Last 10 Lumber monthly O/H/L/C
6.30) Lumber opinion
6.31) Last 10 Cotton monthly O/H/L/C
6.32) Cotton opinion
6.33) Last 10 Orange Juice monthly O/H/L/C
6.34) Orange Juice opinion
Identifying the trend is only 1/3rd of the battle to win the war of becoming a profitable trader, the other 2/3rds is how you structure your trades.
For full disclosure of how we set profit objectives and define risk on every trade and for the duration of every trading period see this link.
If you have questions send us a message or schedule an online review .
Regards,
Peter Knight Advisor
—————————————————————-