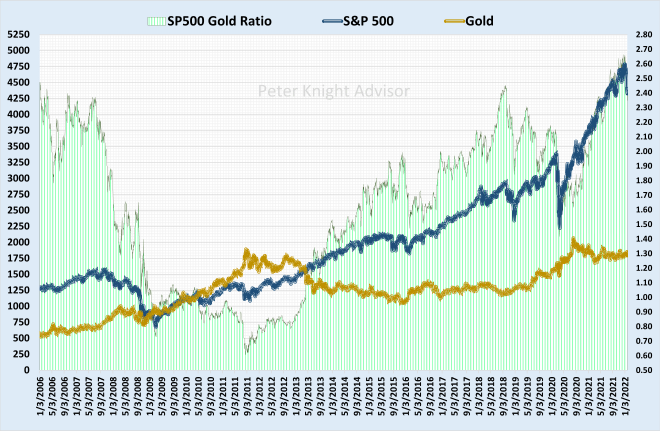
Breton Woods 1944, the U.S. dollar was backed by gold, respected internationally and became the World’s reserve currency.
2022 the dollar is a fiat currency, back by nothing, whose central bank creates by the trillions to buy the majority of all new downgraded Federal debt at non-competitive rates.
What happened?
In 2008 politicians discovered “quantitative easing” and quickly realized they could instruct the Federal Reserve to create any amount of money they wanted to spend on nearly anything in the name of “economic stimulus” or “crisis”, following their instructions the Federal Reserve created 8.756 trillion, 7.865 trillion of it since 2008, 4.698 trillion over the last 24 months, total created is expected to be nearly 9 trillion by May of 2022.

Sources & Data
How much is 8.756 trillion? 461 billion more than the total debt of China, 4.698 trillion in 24 months? 237 billion more than the combined total debt of Brazil, Argentina, Mexico, Turkey, Greece, Russia and Indonesia.
In addition to the 8.756 trillion in created money the Federal Reserve forfeited 1.258 trillion in operating profits to the U.S. Treasury, 1.002 trillion of it since 2008.
 Sources & Data
Total Federal Reserve funded bailouts 10.014 trillion or 273 billion more than the combined total debt of Russia, China, Taiwan, Hong Kong, Greece and Argentina.

Sources & Data
Fed bailouts and new Federal debt, 105 years pre covid, versus the last 24 months.
Formation of the Federal Reserve 1913
-
- 1913-2007, 94 years
- New Federal debt 8.951 trillion
- Total Fed funded bailouts 1913-2007, 890.66 billion
2008-2019, 11 years
-
- New Federal debt 13.719 trillion
- Total money created by the Federal Reserve 3.275 trillion
- Federal Reserve profits forfeited to the U.S. Treasury 892 billion
- Total Fed funded bailouts 2008-2019, 4.167 trillion
2020-2021, last 24 months
-
- Total new Federal debt 6.352 trillion
- Total money created by the Federal Reserve 4.698 trillion
- Federal Reserve profits forfeited to the U.S. Treasury 160.65 billion
- Total Fed Funded bailouts 2020 & 2021, 4.859 trillion
6.352 trillion in new Federal debt (in 24 months) is 8 times more than the cost of FDR’s new deal that built America’s infrastructure, fueled the U.S. out of the great depression and prepared it for World War 2.
-
- Total cost of the New Deal from 1933 to 1939, 41.70 billion (1934 USD)
- The BLS.GOV translates this into 809.27 billion in 2022 dollars
- Total cost of the New Deal in gold 1.226 million ounces (Gold at $34.01 per troy ounce)
- Cost of the New Deal in 2021 if pegged to gold 2.207 trillion dollars
6.352 trillion is 1.95 trillion more than the total fiscal cost of World War 2.
-
- U.S. fiscal cost of World War 2, 291.18 billion (1946 dollars).
- The BLS.GOV translates this into 4.347 trillion (2022 dollars)
- The fiscal cost of WW 2 was 59.59% of what the Federal Government spent in 2020,
- 97.35% of what the Federal Government spent in 2019.
- U.S.’s fiscal cost of WW 2 in gold, 131.662,000 ounces
- Cost of the WW 2 if pegged to gold 15.088 trillion (2022 dollars)
6.352 trillion justified by a virus that according to the CDC is 1/4 as lethal as road injury for citizens with no preexisting life threatening conditions.

Sources & Data
Impact of record deficit spending and the Fed’s creation of money on U.S. fiscal creditability.
From 2008 through 2012 Federal debt increased by 7.100 trillion, at the same time the Fed created 2.016 trillion with keypunch entries, record new debt and the creation of money to partially fund it caused S&P to downgrade U.S. Federal debt for the first time in 2012, from AAA to AA+, the U.S. now shares the same debt rating as Hong Kong and Finland.
Since 2012 Federal debt has increased by another 12.981 trillion during the same period the Fed created another 5.918 trillion, this increase in debt and the creation of money to partially fund it sets the U.S up for the next S&P debt downgrade from AA+ to as low as AA- if AA- occurs the U.S. will share the same debt rating as the Czech Republic, Estonia and Japan and the World will be far more motivated to replace the U.S. dollar as the World’s reserve currency with a basket of currencies or a new global currency backed by tangible assets.
 Sources & Data
20.71 trillion in new Federal debt took the U.S.’s debt to GDP ratio from 61.93% at the beginning of 2008 to 125.77% by December 2021, the worst in U.S. history

Sources & Data
20.071 trillion, is more than the combined total debt of the United Kingdom, Canada, Australia, Israel, South Korea, Mexico, Taiwan, China, Russia, and India.

Sources & Data

Record deficit spending has reduced annual Federal revenue from 58.89% of total Federal debt to just 13.85%. If additional “stimulus” is approved total annual revenue will fall to less than 10.00% of total Federal debt.
1970 50.62%
1980 58.89%
1990 32.19%
2000 35.98%
2007 28.69%
2021 13.85%
 Sources & Data
A 13.85% annual Federal revenue to total Federal debt ratio makes it impossible for the U.S. to raise rates high enough to attract enough buyers on the open market to fully fund existing deficit spending much less any additional “stimulus”. Buyers on the open market, (using their own money, not banks using money ultimately created by the Fed) are going to want a positive rate of return, not a negative rate of return greater than 4.75%.
If Treasury rates normalized to the pre QE average of 8.70%, 62.83% of total Federal Revenue would be consumed by debt service cost alone.
 Sources & Data
Treasuries as an investment 1970-2019 versus Dec 2021
1970-2007
-
- Average Treasury rate 8.70%
- Average reported inflation 4.70%
- Average positive rate of return 4.00%
2008-2019
-
- Average Treasury rate 2.72%
- Average reported inflation 1.77%
- Average positive rate of return 0.96%
December 2021
-
- Average Treasury rate 2.01%
- Reported inflation 7.20%
- Negative rate of return 5.19%
 Sources& Data
10 Year Treasuries pre “quantitative easing” versus Dec. 2021
-
- Pre QE Treasury debt rating AAA (the highest possible)
- Average price for a 10-year, $100,000, 5.00% coupon $87,524
- Average yield on a 10-year, $100,000, 5.00% coupon 7.01%
- Average BLS.GOV and more accurately reported inflation 3.16%
- Average positive rate of return 3.85%
December 2021
-
- Treasury Rating AA+ (the lowest in history, same as Hong Kong & Finland)
- 10-Year, $100,000, 5.00% coupon, yield 1.43%
- 10-Year, $100,000, 5.00% coupon price $133,050
- Reported and less accurate BLS.GOV inflation 6.90%
- Negative rate of return 5.07%
- Instrument profit at the low for the 10-year rate of 0.62%, $9,290, +6.98%
- Instrument loss at the pre QE average of 7.01%, -$45,526, -34.22%
- Instrument loss at the high for the 10 year of 14.30%, -$81,000, -60.88%
- Dollar volatility and inflation adds additional risk on a Treasury position.

Sources & Data
The only thing guaranteed in 2022 on the 10-year Treasury is a loss
If you were 35, wanted to retire at 65, bought a 30-year Treasury 5.00% coupon in December 2021 yielding 1.81% and were in a low tax bracket (28% Fed & State) the buying power of your 30-year Treasury would decline 79.83% by maturity, this assumes reported inflation is accurate and taxes remain constant.
 Sources & data
From January 2008 through February 2020 monthly Fed bailouts averaged 22.383 billion, since March 2020 they’ve averaged 210.54 billion.

Sources & Data
In 2021 there’s no one to replace the Fed and buy 54% of all new Federal debt
-
- Treasuries have a negative rate of return greater than 5.00%
- The worst debt rating in history with more debt downgrades on deck
- Issued by a country with the worst debt to GDP ratio in its history
- Denominated in a currency the Fed creates by the trillions at the whim of politicians
The U.S. debt crisis is now beyond the point of no return.
On the 26th of March 2020 the Federal Reserve reduced the 10% bank reserve requirement to zero resulting in a spike in money supply (M1) from 4.776 trillion in March of 2020 to 20.244 trillion in January 2022.
The elimination of the 10% reserve requirement allows banks to create money, borrow, and lend without reserves, ensures the next banking crisis, more QE, continued high inflation and further dollar devaluation against tangible assets, quality stocks and further U.S. debt downgrades.

Sources & Data
This video explains how banks borrow at near 0.00% from the Fed, leverage it, speculate with it, receive the profits while the taxpayer assumes the risk.
Since 2008 more “stimulus” money has found its way to Wall Street than Main Street.
 Sources & Data
Foreign held Treasury debt adds to the risk of holding U.S. dollars and debt.
Since 1970, regulation, taxation and litigation has forced U.S. companies to outsource offshore resulting in 14.125 trillion of wealth leaving U.S. balance sheets through trade deficits,
7.080 trillion since January 2008, 1.527 trillion since January 2020 and its not getting any better, in 2021 the U.S. is set to have it’s it’s worst trade deficit in history 846 billion, previous worst case 764 billion in 2006, 1 year before the last financial crisis started in 2007 and had fully engaged by 2008.

Sources & Data
Of the 14.182 trillion in wealth that’s left U.S. balance sheets to foreign 7.549 trillion is currently parked in U.S. Treasuries.
 Sources & Data
With debt rocketing higher and the Federal Reserve creating trillions to finance the majority of it, does anyone honestly believe foreign holders of more than 7.5 trillion of U.S. Treasuries will maintain their positions in U.S. dollars and debt as Treasury prices, the dollar, and the U.S.’s debt rating fall deeper into the sewer? Adding to risk is the very good possibility the U.S. dollar will lose its status as the World’s reserve prior to 2030.
11 countries now have higher rated debt than the U.S., all have substantially better debt to GDP. ratios, for a foreign investor, the debt of these countries, SDR’s, gold, real estate, quality international stocks or a new world reserve currency backed by tangible assets all offer a far better alternative than U.S. dollars and debt.
 Canada Canada |
AAA |
Stable |
2002-07-29 |
 Denmark Denmark |
AAA |
Stable |
2001-02-27 |
 Germany Germany |
AAA |
Stable |
2012-01-13 |
 Liechtenstein Liechtenstein |
AAA |
Stable |
2016-02-26 |
 Luxembourg Luxembourg |
AAA |
Stable |
2013-01-14 |
 Netherlands Netherlands |
AAA |
Stable |
2015-11-20 |
 Norway Norway |
AAA |
Stable |
1990-11-08 |
 Singapore Singapore |
AAA |
Stable |
1995-03-06 |
 Sweden Sweden |
AAA |
Stable |
2004-02-16 |
 Switzerland Switzerland |
AAA |
Stable |
1989-06-26 |
 Australia Australia |
AAA |
Stable |
2020-10-20 |
 Austria Austria |
AA+ |
Stable |
2013-01-29 |
 Finland Finland |
AA+ |
Stable |
2016-09-16 |
 Hong Kong Hong Kong |
AA+ |
Stable |
2017-09-22 |
 United States United States |
AA+ (S&P)
|
Stable/Negative |
2013-06-10 |
What we know
-
- Reported BLS.GOV inflation is fictional
- Elimination of the 10% bank reserve requirement assures another banking crisis & bailout
- The trillions in QE & M1 tell us inflation and debt monetization have fully engaged
- The U.S. can’t afford to pay high enough rate on its current debt to attract enough buyers on the open market to fully fund current spending, much less the proposed “stimulus”.
- Real rates of return aren’t going to happen this decade
- Tapering, not inflation is transitory,
- U.S, debt will be downgraded by 2030
- Trade deficits will continue to suck wealth off U.S. balance sheets and onto foreign
- Sales of 7.5+ trillion in foreign owned Treasury debt and dollars will likely engage.
- The Fed will create trillions more trying to support the dollar, U.S. debt market and banks.
- Reported inflation will escalate above 8.00%, true inflation north of 9.00%.
- Growth in Federal debt will outpace growth in Federal revenue by more than 1.5 to 1
- Desperate for income politicians will pass increases in income, corporate and long-term capital gains taxes forcing more corporations and citizens offshore, tax hikes could provide a short term solution but will do more long-term damage than short-term good, just like QE.
- Stocks will have 1 to 3 corrections with recovery to new highs fueled by dollar devaluation and central bank intervention, again using money created with keypunch entries.
- Proceeds from stock sales may go into Federal debt short-term but just until these dollars find new homes in tangible assets, higher quality stocks and higher rated debt.
- Federal Reserve ownership of Federal debt will escalate from the current 5.911 trillion to more than 9 trillion by 2028
- U.S. Mortgage delinquency rates will increase from 2.25% to more than 5.00%
- Federal Reserve ownership of mortgage-backed securities will increase from the current 2.57 trillion to over 4 trillion dollars by 2028
- A temporary selloff in real estate will be caused by higher rates, higher taxes, higher inflation, decreasing affordability with a recovery to new high fueled by dollar devaluation.
- Debt monetization is the only remaining option for the Federal Governement in 2022
Debt monetization 101
1) Under report inflation to contain the majority of all Federal costs tied to reported inflation which include debt service cost, increases in Social Security, Medicare, Military and Civilian employee pensions, nearly every government expense is tied to reported BLS.GOV inflation.
Example, from 2008 to 2021 Federal debt increased by 224.23% yet annual debt service cost increased by only 39.42%.
-
- Federal debt 2007 8.950 trillion, annual debt service cost 411.32 billion
- Federal debt 2021 29.020 trillion, annual debt service cost 573.457 billion
 Sources & Data
-
- Under reporting inflation strips the free market economy of trillions of dollars in interest income, retirement benefits and pension payouts, citizens lose, banks and government benefit.
- Treasuries are denominated in dollars, Inflation reduces the value of dollar against everything, dollar devaluation equals Treasury debt devaluation, holders of Treasury debt lose, banks and government benefit.
- Inflation pushes the prices of goods, services, tangible assets and stocks higher increasing tax revenue, citizens lose, banks and government benefit.
2) Under report budget deficits to give citizens a false sense of security
1970-2020 cumulative reported budget deficits were $17.857 trillion, cumulative increase in Federal debt $26,515 trillion. According to U.S. politicians the 8.658 trillion doesn’t count because they’re mandatory expenses and they don’t get to vote on them.

Sources & Data
Difference between reported deficits and increase in total Federal debt
1970 to 2007 4.021 trillion,
2008 to 2020 4.637 trillion.
3) Under report the poverty rate to contain all subsidies linked to the poverty rate.The Federal Government contained the official poverty rate and all subsides linked to the poverty rate by lowering what the poverty rate is.
In 1970 if your income was less than 49.60% of median personal income you were below the poverty threshold and qualified for government assistance.
In 2020 your income needed to be below 21.70% of median personal income to be below the poverty threshold to qualify for government assistance.

Sources & Data

4) Under report the homeless rate
By redefining who’s homeless the Department of Housing and Urban development has reduced the official homeless rate between 2005 and 2020 by 173,691 people this enbles politicians to redirect resoucres for those who really need them to programs that will enrich them.
The objective of government during monetization is to control all cost increases linked to reported inflation, provide citizens with a false sense of security while devaluing debt in terms of constant dollars while increasing tax revenue.
U.S. debt monetization scorecard 1970-2021.
GDP per capita for 2021 is estimated at $70,444, if pegged to reported inflation it would be $37,972, if pegged to gold $55,486. Monetization is working, the economy is growing nearly twice as fast as reported inflation.

Sources & Data
Personal Income for 2021 is estimated at $61,352, if pegged to reported inflation it would be $30,344, if pegged to gold $44,339. Monetization is working, income and income taxes are increasing more than twice as fast as reported inflation.

Sources & Data
Median 2021 sales price of a home $404,700, if pegged to reported inflation it would be $162,580, if pegged to gold $237,568. Monetization is working, property taxes and taxes on gains are increasing more than twice as fast as reported inflation. .
 Sources & Data
S&P 2021 4615.00, if pegged to reported inflation it would be at 662.91 if pegged to gold 968.67. Monetization is working, taxes on gains are increasing more than 4 times faster than reported inflation.
 Sources & Data
Annual Federal Revenue per capita for 2021 $12,284, if pegged to reported inflation it would be $6,725, if pegged to gold $9,827. Monetization is working, Federal Revenue is increasing nearly twice as fast as reported inflation,
Note the revenue spike higher in actual Federal revenue per capita from $10,339 in 2019 to $12,284 in 2021, +15.83%.

Sources & Data
A higher percentage of the population (45.10%) was working in 2021 than 40 out of the last 52 years, they’re incomes have outpaced reported inflation more than 2 to 1, Federal revenue in 2021 is at a record high, ask yourself, how could the U.S. pile on 6.352 trillion in new Federal debt in the last 24 months with these numbers?
-
-
- Working population is 1.68% from all-time high in 2000
- 3.02% higher than the 52-year average,
- 10.75% higher than the 52 -year low in 1971
- Personal income has outpaced inflation more than 2 to 1
- Federal revenue has outpaced reported inflation by nearly 2 to 1
 Sources & Data
The problem, monetization only works if spending is contained or reduced, growth in revenue has to outpace spending or you end up with a larger problem than the one you were trying solve with monetization.
Federal Spending per capita 2021 $23,063, if pegged to reported inflation it would be $7,023, if pegged to gold $9,866. Monetization can’t work with Federal spending outpacing reported inflation more than three to one.
 Sources & Data
Federal debt per capita 2021 $88,053, if pegged to reported inflation it would be $13,574, if pegged to gold $19,835. Monetization can’t work with Federal debt outpacing reported inflation 6.5 to 1.
 Sources & Data
Where there is chaos there is opportunity
These are several of the the many programs we track and trade if you’d like information on Managed Futures 16 Categories or Hedge Funds 46 Categories, please register specifying your sectors of interest, initial investment amount, and risk tolerance.
If you have any questions, contact me.
 Peter Knight
Voice & Video Chats.
Message me
>
Privacy Notice
Disclosure