
On 10 February 2022 the world’s most liquid interest rate derivatives market was pricing in the following 3 month deposit rates through December 2031. What this market is telling us is that there will be 8, 0.25% rate hikes between now and December 2023,

Its delusional to think a 2.35%, 3 month deposit rate would reduce inflation from 7.50% to less than 2.50%, 2.35% given current fundamentals won’t even contain inflation.
Over the last 24 months the Federal Government has cranked up nearly 7 trillion in new Federal debt. At the same time the Federal Reserve created nearly 5 trillion with keypunch entries for bailouts.
In March of 2020 the Federal Reserve dropped the Federal bank reserve requirement from 10.00% to 0.00% allowing banks to create borrow and lend money without reserves, this resulted in a spike in money supply (M1) from 4.6 trillion to over 20 trillion.
One position I believe has superior potential is trading the expected increase in rates between December 2023 and December 2027 from the current – 0.095% to +1.555%, if this occurs the anticipated 3 month deposit rate by December 2027 would be at 3.50% or 4.00% less than February’s reported inflation of 7.50%.
$25,000 allocation
Long 20 contracts GEZ23 at 97.640
Short 20 contracts GEZ27 at 97.765
Price –0.1250%
Chart to monitor this position with 15 minute updates, each 0.01 =$500.00

GEZ23 GEZ27 220210 to experiment with any investment amount, number of contracts traded and potential outcomes for this trade.

-
- Enter number of contracts traded cell C-2
- Investment amount C-3
- Spread entry in percent cell E-2
- Current price to monitor this position using this chart E-3 or experiment with any potential outcome for this trade in cell E-3
- Profit or loss shows in Cell D-9
- At the historic high 1.6950% on 19 March 2021, $25,000 would appreciate to $115,220
- At the historic low of 0.125%, put in on 10 February $25,000 would be worth $25,000
- From 0.125% to lose the $25,000 market anticipation for rate cuts would have to move from the current -0.125% to a rate cut of 0.625% between December 2023 and December 2027.
Fundamentals that will fuel the move higher in rates
Ask yourself how you can contain inflation when the Federal Reserve has created a total 8.756 trillion with keypunch entries, 7.865 trillion since 2008, 4.698 trillion in the last 24 months. 4.698 trillion in 24 months? that’s more than the total fiscal cost of World War 2 and 5 times more than FDR’s New Deal that built America’s infrastructure in the 1930’s.

26 March 2020 the Federal Reserve reduced the 10% bank reserve requirement to zero resulting in money supply (M1) surging from 4.776 to 20.244 trillion.
The elimination of the 10% reserve requirement now allows banks to create nearly any amount of money, borrow, lend, and speculate with it, without reserves? This ensures the next banking crisis, more QE, continued high inflation and further long-term dollar devaluation against tangible assets and quality stocks.

This video explains how U.S. banks borrow near 0.00%, leverage it, speculate with it, receive the profits, while the U.S. taxpayer assumes the risk.
Since 2008 more “stimulus” money found its way to Wall Street than Main Street.

This increase in money created by the Fed and banks makes it impossible for the United States to contain inflation, now that reported inflation is above 7%, true inflation north of 9% the Fed wants to taper and to try to contain it?, way too little, way too late.
Treasuries as an investment 1970-2019 versus Dec 2021
1970-2007
-
- Average Treasury rate 8.70%
- Average reported inflation 4.70%
- Average positive rate of return 4.00%
2008-2019
-
- Average Treasury rate 2.72%
- Average reported inflation 1.77%
- Average positive rate of return 0.96%
December 2021
-
- Average Treasury rate 2.01%
- Reported inflation 7.12%
- Current negative rate of return 5.11%

From January 2008 through February 2020 monthly Fed bailouts using created money averaged 22.383 billion, since March 2020 they’ve averaged 210.54 billion.

Tapering and normalization of rates is no longer an option for the U.S. with total annual federal revenue now a mere 13.85% of total federal debt.
1970 50.62%
1980 58.89%
1990 32.19%
2000 35.98%
2007 28.69%
2021 13.85%

If Treasury rates normalized to the pre qualitative average of 8.70%, 62.83% of total Federal Revenue would be consumed by debt service cost alone.

We’re already seeing the impact from one round of tapering and rumored rate hikes on the equity market, sharp sell offs that have been contained by massive intervention funded by trillions of dollars created by Western banks (increase in money supply M1 and money created by the Fed QE).

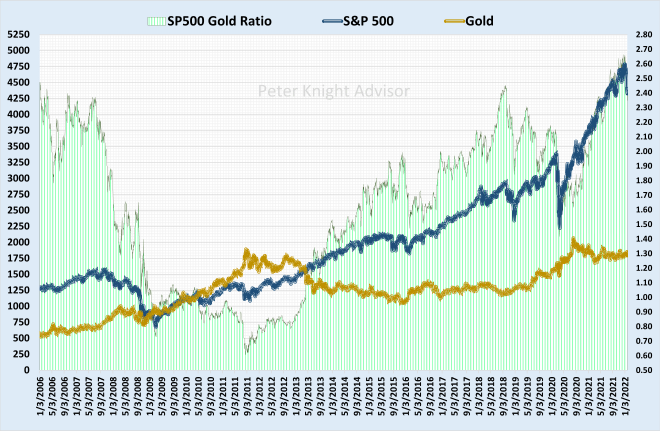
Additional intervention money was raised from heavy sales of gold which explains why gold has been such a flat liner despite reported inflation above 7.00% and true inflation north of 9.00%. but Gold will have its day in the sun, until then we can trade hedged option write programs.
Massive intervention in the U.S. equity market is failing, institutions are aware of this, evident by the massive increase in options volume as these institutions hedge their long positions.
Once hedging is completed I believe institutional liquidation of long positions will fully engage, most likely timed with the end of QE so the Fed will take the blame for the hard market selloff. Those that are allowed to will create net new short positions, fueling the market even lower, increasing the value of the new short positions and the puts they already own.
Daily on the NASDAQ rolled to short on the technical indicators 4 January 2022, overall market opinion at the time of this report was also a sell.
24th of January the weekly rolled from long to short

When the the monthly rolls to short the next bear market has officially engaged.

The sell-off in stocks will give the Federal Reserve the justification they need to continue creating trillions with keypunch entries to buy Federal and mortgage debt at noncompetitive rates. What the Federal Reserve is doing isn’t new, it’s called monetization and it’s been around since money was created.

When the QE printing press shifts into overdrive rate hike expectations will move from before December 2023 to after 2023 which will buy the Federal Government and Federal Reserve more time to try and figure out how they can contain the mess that they and politicians have created.
Chaos equals opportunity, it’s going to be a great year for trading packed with major market moves in indices, metals, energy, currencies and crypto long and short, message me if you’d like to track our trades in other markets as they occur.
Peter Knight Advisor
Direct VI Phone 24/7 +340 244 4310
Skype: Peter-Knight-Advisor
Message me
Schedule an online review
Peter_Knight@peterknightadvisor.com