Brexit was just a teaser of the major market moves we’ll be able to trade

Thank you Brexit for the moves you generated in the S&P, bonds gold and currencies but I am a little disappointed that’s all you had in you.

The UK  economy is 3.94% of global GDP, we got more play out of Greece,  an economy equivalent in size to Orange County California.

GDP

Pound shorts were decent, less than expected, the  Swiss moved more when they defected.   pound

FTSE 100 shorts were a bore
FTSE 100

Dax shorts you could ignoreDaxS&P 500 shorts couldn’t gather momentum I’ve seen better moves generated by Fed intentions. sp

A $3.00 drop additional pumping has out do this $3.00 pop and were sitting at $48 like nothing happened.

Oil

Gold that loves bad news didn’t even make the news

gold

Even though the moves generated by Brexit were disappointing,  there is an upside  Brexit was  yet another crack in the dam of poorly constructed global policy decisions.

I believe this policy dam will break generating major market moves that will rival anything we’ll see in our trading careers.

We all can see the US debt typhoon clearly on the horizon. We all know if rates normalize as Yellen represents  the US can’t afford to refinance its maturing debt much less new issues that need to be sold finance new debt.

After this last blast to the upside I can’t see anyone buying low yield US debt?  The dollar is near a 10 year high, instruments prices are at all time highs, currency and instrument risk in one hour is more than than annual yields?

Banqiao Central Bank policies     

Over the last several decades Central Bank Monetary policies in majority have been hastily created by appointed academics anxiously awaiting the opportunity to test their hypothetical economic theories based more on ego & arrogance than “real world” work experience.

Their inexperience and arrogance led this fester of academics to believe they could actually solve the debt crisis by making the debt crisis even larger.

The harsh reality is the US has the worst debt to tax receipt ratios in history, the worst credit rating in history and the most miscreant reporting by governmental agencies on economic statistics such as inflation and labor in history.

Envision Central Bank/Fed policy to a Dam holding back the debt crisis and name it after its hydrology counterpart the Banqiao.

The Banqiao Dam was hastily designed by academics using unproven hydrology theory with ½ as many gates as recommended. Academic theory enabled the dam  to be built in a shorter period of time to solve the long term problem of unmanageable flooding in the Huai river basin which peaked in 1949 & 1950.

Construction of the Banqiao dam began in April 1951 and was completed in June 1952. Aside from a few figureheads the Banqiao dam was designed by academics with impeccable  credentials but lacked the actual work experience in hydrology.

Dam 1

In the in the 1950’s & 1960’s the Government acknowledged the Dam might some “minor” structural issues as it was in majority made out of clay. They also acknowledged it cost multiple times what was represented and dam wasn’t expected to work as originally represented. In the coming decades more money was spent on trying to repair the dam than the cost of a new one.

Dam 2

The ambiguous tone, unfounded optimism in the Banqiao dam reports is very similar to what is currently being used by Central Bankers to explain why their economic recovery programs haven’t worked as expected despite costing  multiple times what was represented.

The US debt to tax receipt ratio is a perfect example of the Fed’s economic recovery “design flaw”.

Red = Federal debt
Green = Debt service on the national debt
Blue = Debt held by Federal Reserve Banks
Black = Federal government receipts from personal taxes
Grey = Federal government receipts from corporate taxes

3
Source Federal Reserve

In the 1950’s through 1970’s The Chinese government told residents not to worry as a team of skilled professionals with the help of the Soviets was deployed to monitor and resolve any issues with the dam, they told residents to feel safe despite the weight of water behind the dam and  patient.

Dam 3

From 2008-2016 the US Government has told its residents not to worry as a team of skilled professionals (the Fed) has been deployed to resolve any issues with the Economy, to feel safe about the weight of debt behind the “economic stimulus” dam and to be patient during “economic recovery”.

Actual pictures of the Fed team with their linked bios on this Seeking Alpha page

5

Typhoon Nina landed onto the scene with a bang in 1975, hitting China hard and quickly destroying the Banqiao Dam.

The dam collapsed killing approximately 26,000 people from the initial flooding and another 145,000 during subsequent epidemics and famine. 5,960,000 buildings collapsed, 11 million residents were affected. Unofficial estimates of the number of people killed by the disaster have run as high as 230,000. The collapse of the Banqiao Dam led to such great flooding that it set off a series of dam collapses throughout China, greatly magnifying the damage.


6

Over the last 24 months the Federal Reserve has lowered its expectation for where they see the Fed Funds rate they set by December 2018 from 3.75% down to 2.50%. With each reduction in rate expectation they are confirming the failure of their policies

During the latest Fed “guidance” Yellen again confirmed that the Fed’s projections for the economy and interest rates were wrong. Yellen predictably regurgitated the same pathetic rhetoric feed to her by her keepers  about “low” inflation,  meaningless timelines for interest rate hikes and then tells us to be patient while failed Fed polices continue to destroy the  US’s economic future.

June 2016 “ rates will be 2.50% by December 2018, “economic recovery” is taking longer than expected, inflation is lower than expected.

March 2016 ” rates will be 3.00% by December 2018,  economic recovery” is taking longer than expected, inflation is lower than expected.

December 2015 ” rates will be 3.25% by December 2018 “economic recovery” is taking longer than expected, inflation is lower than expected.

September 2015 ” rates will be 3.50% by December 2018, “economic recovery” is taking longer than expected, inflation is lower than expected.

September 2014 ” rates will be 3.75% by December 2018, “economic recovery” is taking longer than expected, inflation is lower than expected. (Yes she’s wearing the same outfit)

Source Federal Reserve

The math on “economic recovery”  

The US debt to  GDP ratio is currently the worst since World War II at 105% and is quickly closing in on the all time high of 113%

  • Current debt to GDP ratio 105%
  • Debt to GDP in 2009 when “economic recovery” officially began 80.10%
  • Debt to GDP at the height of the Great Depression 39%
  • All time high debt to GDP during World War II 113%

Screenshot_50Source Federal Reserve

Budget deficits still exceed 400+ billion annually. Each 1.00% increase in debt service could  add 192 billion to the current 400+ billion annual deficits.

Screenshot_41Source Federal Reserve

The Tax receipt growth to Federal debt ratio is by far the worst in history.

From 2008-2015 the US national debt increased by 104% while tax receipts increased by only 36%.

Red = National debt
Black = Personal income tax receipts
Blue = Corporate tax receipts

Screenshot_48Source Federal Reserve

The worst debt to personal income ratio in history

Red = National debt
Green =  Personal income

Screenshot_53Source Federal Reserve

The worst debt to employed population ratio in history.

Red = National debt
Green = Non Farm Payroll
Black = Total Population

Screenshot_51Source Federal Reserve

Millions in the US annually are still losing their homes.

  • US Mortgage delinquency rates remain at 6.16% in 2016
  • 6.16% is nearly twice the pre recession all time high of 3.36%
  • Nearly 3 times the pre recession average of 2.24%

Screenshot_56 Source Federal Reserve

Home ownership in the 21st century is at a new all time low.

Screenshot_132
Source Federal Reserve

The worst trade deficits on record, over 5 trillion has left the US for foreign shores since “economic stimulus and recovery” began.

  • From 1960 to 2007 the cumulative trade deficit was 7.73 trillion US dollars
  • From 2008 to 2016 5.13 trillion
  • Cumulative total increase from 2008 to 2016 66.31%

Since 1960 12.86 trillion in wealth has transferred from domestic to foreign accounts.

Screenshot_51Source 1960-2013 Federal Reserve
Source 2014-2016 Trading Economics

“Quantitative Easing”

“Quantitative Easing” created 4.19 trillion dollars with keypunch entries backed by no tangible assets or income flow to;

  • Bail out the banks that facilitated the debt crisis
  • Purchase record amounts of US Federal debt that no one else would buy at non competitive interest rates
  • Force and hold rates at historic lows enabling the US Treasury to finance over 10 trillion in new Federal debt at the lowest rates in history.

4.19 trillion is nearly 5 times greater than total Federal debt was during the “inflationary debt crisis” of 1980 when short term rates soared above 18%.

1980 Federal debt = 863 billion ( 2.50 trillion in 2016 dollars)
2016 Federal debt = 19.23 trillion

Fed’ balance sheet

Red = 2.46 trillion in US Treasury
Green= 1.73 trillion in bad bank debt

Screenshot_52Source Federal Reserve

The US now has the worst debt rating in its history

13 countries now have a higher debt ratings than the US, most have the same or higher deposit rates.

Screenshot_54
Supporting Data

China by the Fed’s own numbers buried the US during “economic stimulus & recovery”

The worst growth ratio on record against China

Blue = US GDP Growth
Red = China GDP Growth

Screenshot_58Source Federal Reserve

The worst debt to GDP ratio on record .

Blue = US Debt to GDP
Red = China’s Debt to GDP

Screenshot_57Source Federal Reserve

The “balance” of trade was beyond ugly

Blue = US “Balance” of Trade
Red = China’s “Balance” of Trade

Screenshot_117Source Federal Reserve

The widest spread on record between the US’s and China’s short term interest rates

Screenshot_61Source  Federal Reserve

During “economic stimulus and recovery” the USD had an overall depreciation of 10.27% against the Chinese Renminbi despite massive intervention by the Chinese to devalue their currency.

Screenshot_77Source Federal Reserve

The World Bank tells us China’s economy will surpass the US’s by 2019

Source World Bank

What “economic stimulus” did for savers

Over the last 8 years artificially low rates have stripped savers and the free market economy of trillions of dollars in interest income through the largest negative rates of return in history.

How does stripping savers and the free market economy of trillions of dollars to save the US Treasury the same amount in debt service cost stimulate an economy and foster economic recovery?     It doesn’t and never will.

Red = The BLS.GOV reported Consumer Price Index (CPI)
Black = 3 Month deposit rates
Blue = 3 month deposit rates outside the Treasury system
Green = 2 year deposit rates

Screenshot_53
Source  Federal Reserve

What “economic stimulus” did for banks

While savers were being stripped of trillions the same banks that facilitated the debt crisis received trillions in Fed bailouts.

It gets worse

Since 2009 the Fed has permitted banks to gorge on the largest gross profit margins between bank borrowing cost and lending rates in history transferring these trillions from consumer balance sheets directly to bank balance sheets.

In 2009 when the Fed Funds bank borrowing rate dropped to 0.13%,  the prime rate remained unchanged at 3.25%, then rose to 3.50% December 2015.

Consumer credit card rates during “economic stimulus and recovery” never had a meaningful decline remaining above 13.00% since 2009, very close to the 20 year average of 14.22%.

How does overcharging consumers trillions in inflated borrowing costs to benefit the same banks that caused the debt crisis stimulate an economy and foster economic recovery?        It doesn’t and never will.

Fed Funds bank borrowing rate relative to bank lending rates

Red = Fed Funds bank borrowing rate
Black = Prime lending rate
Green = Average credit card rate
Blue = 30 year conventional mortgage rate

Screenshot_38Source Federal Reserve

Not that Japan is any example to follow but when Japan’s deposit rates went to zero the  Japanese had the conscience to lower their prime lending rate to 0.95%

At 0.95% Japan’s Prime Rate is less than 1/3 of the 3.00% gross profit margin spread between the US Fed Funds bank borrowing rate and the US Prime rate.

Screenshot_39
Source
  for the Bank of Japan

What economic stimulus did for the US Treasury

  • Enabled the Treasury to finance over 10 trillion in new deficit spending at the lowest rates in history.
  • Allowed the US Treasury to refinance existing Federal debt at the lowest rates in history (Maturity Extension Program)
  • Lock in the US Treasury’s debt service cost at the lowest rates for the longest period of time in history the average, Treasury duration is now nearly 6 years, average yield less than 2.75%

Red = Federal Debt
Blue = Federal Debt Held by Federal Reserve Banks
Light Blue = Social Security
Green = Federal debt service cost that the Fed has stopped reporting

Screenshot_90Source Federal Reserve

Fed fiction is nothing new

For over a 1/2 a century the Federal Reserve, US Treasury and Bureau of Labor and Statistics have relentlessly worked together to “stabilize and preserve” the US financial system.

In the 1960’s Fed Chair William McChesney Martin was facing inflation and escalating Federal deficits, Martin using the independence gained with the Treasury-Fed Accord begin creating the “new” Federal Reserve. 

1970 Arthur Burns became Fed chair, by 1971 he along with president Nixon took the US dollar off the gold standard and the dollar became  a  “fiat” currency.  (Fiat currency = a currency backed by no tangible asset or income flow)

1971 Publicly Burns made himself out to be an inflation hawk. He testified that the Fed was “determined to follow a course of monetary policy that would permit only moderate growth in money and credit,” making it “possible for the fires of inflation to burn themselves out.”

Didn’t happen,  during his eight-year tenure as Fed chair Burns failed to control prices by 1974 inflation was above 12% and the average during eight-year was an unprecedented rate of 6.5%.

Orange = BLS.GOV Consumer Price Index
Purple = Total Imputed Interest Paid
Red = Federal Debt
Blue = M1 Money Supply

Screenshot_133
Source  Federal Reserve

in 1974 several Fed members approached the BLS.GOV and began persuading them to begin penciling out ways of revising the BLS.GOV releases to more “accurately” report inflation and employment.

Higher rates and minor BLS.GOV revisions pressured the inflation rate from 12% to below 6% by 1976. Investors started  believing that maybe a currency backed by no tangible asset or income flow could actually work for the largest economy in the World.

Screenshot_65
Source Federal Reserve

Between 1971 and 1980 the US Federal debt grew from 424 billion (2.504 trillion in 2016 dollars)  to 863 billion (2.505 trillion in 2016 dollars)

Screenshot_61
Source  Dollar valuations, Bureau of Labor and Statistics.
Source Federal Reserve

January 1977 precious metals investors choose to ignore the Keynesian economic models advocated by many Fed voting members.

Keynesian economic models  (prior to their current revisions) did not take into account the inflationary implications of the horrific budget deficits that were being generated by the US since it abandoned the gold standard in 1971.

The price of gold rallied

$132.10  January 1977 ($521.56 in 2016 dollars)
$197.50  to a new all time high by July 1978 +49.51%. ($724.76 in 2016 dollars)

By  January  1980 gold was trading at $843.00 up 538.15% ($2,447.78 in 2016 dollars)

Screenshot_81
Source  Dollar valuations, Bureau of Labor and Statistics.
Source Federal Reserve

Inflation, Treasury rates and debt service costs all soared

Screenshot_79
Source Federal Reserve

1979 with the US dollar now a “fiat”  currency it looked doomed, nearly every tangible asset on the board rallied against the US dollar, speculation frenzied, 100’s of millions were being made and lost in minutes.

As gold and silver moved sharply higher in 1979 bullion banks were facing “fails to deliver” on their open contracts.  Bankers, the Fed, US Treasury and exchanges were panicking.

August 1979 Paul Volker is appointed chair of the Federal Reserve

Volker began a series of very aggressive rate hikes to contain inflation as it approached 14.80%. (April 1980)

Screenshot_91
Source Federal Reserve

1980 rule change

Two brothers from Texas  who nearly cornered the silver market and tax straddle  billions in profits into the following tax year provided the Federal Reserve, US Government, Bankers and Exchanges the excuse they needed to enlist the CTFC and IRS to change the rules for trading and taxation on trading US markets.

Position limits
Liquidation only
1256 Tax rule

At the same time the BLS.GOV  was given the “all clear” to use “revisions” more aggressively ” to more “accurately report” inflation and employment.

By 1983 Volker was hailed as a hero because the cumulative impact of his tight monetary polices and BLS.GOV inflation calculation revision magic had dropped the reported BLS.GOV inflation from it’s peak of 14.80% in 1980 to under 3% by 1983.

This video tells the story in 2 1/2 minutes

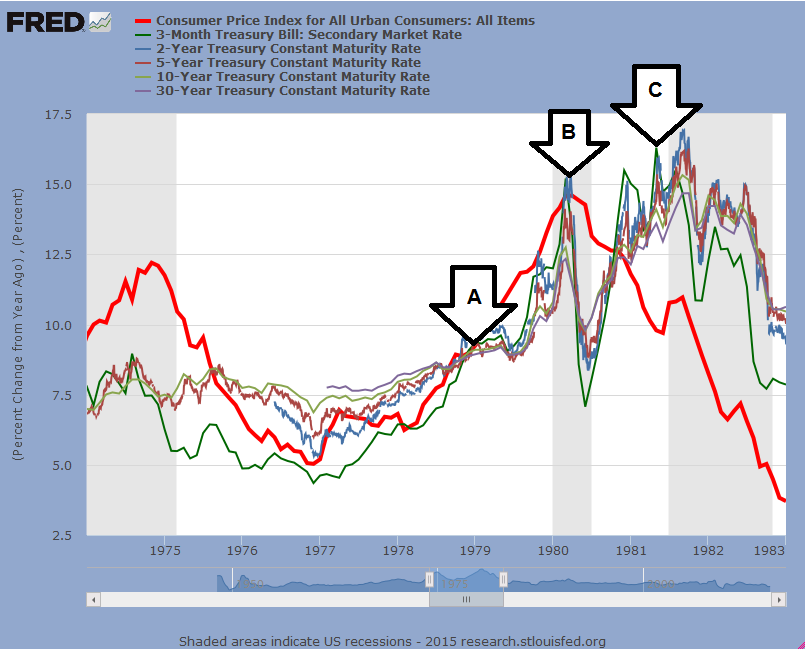
The interest rate market’s reaction to the cumulative policy decisions and rule changes .

A) 1979 Volker begins a series of aggressive rate hike, the curve inverts with short term rates exceeding long term rates
B) 1980 trading and taxation rules change  and “Revised” BLS.GOV  inflation calculation magic engages.
C) After a decade of high inflation it magically lowers from 14.80% to less than 3.00% containing Federal debt service cost and all increases in governmental expenditures that are linked to the “official” CPI such as  Social Security.

Screenshot_56
Source Federal Reserve

Coincidentally in every period since the late 1970’s  when the US has had an inflation, debt or employment crisis we’ve seen revisions as to how the BLS.GOV does their calculations. The more significant the problem, the more significant the revisions.

1987 Alan Greenspan is appointed Chair of the Federal Reserve,

1990 the BLS.GOV implements another round of major revisions to the CPI.

With inflation “contained”Greenspan endorsed easy-money policies at the Fed which fueled the subprime mortgage market.

Screenshot_119


Greenspan Left the Fed 31 January 2006 and Bernanke was appointed the new chair.

Greenspan’s agenda one week after leaving the Fed.

7 February 2006 Lehman Brothers paid Greenspan $250,000 to meet with 15 of its most important hedge fund clients in Lehman’s executive dining room. Greenspan’s primary theme was the white-hot U.S. housing market was slowing down but evidence of it would not show up statistically for several months and it could take more than a year.

Housing prices fell, global investor demand for mortgage-related securities evaporated, many of the attendees at the 7 February 2016 Lehman’s Brothers dinner that negated Greenspan’s advice watched their hedge funds implode as subprime mortgage failures ignited the largest financial crisis in US history.

15 September 2008  Lehman Brothers filed for bankruptcy, at the time it was the largest BK  in history, as its assets far surpassed those of previous bankrupt giants such as WorldCom and Enron.

In the video below Greenspan apologized for nearly 2 decades of  failed monetary policy that put the US into the largest financial crisis in history but kept Lehman’s 250K fee and still earns over 100K per “speaking engagement”

From bad to worse

31, January 2006 Bernanke becomes Fed chair, his bio and his clueless calls on the market that earned him the job to navigate the US out of crisis.

By March 2006 Bernanke had led the Board of Governors of the Federal Reserve System to cease the  publication of the M3 monetary aggregate. The Board also ceased publishing the following components: large-denomination time deposits, repurchase agreements (RPs), and Eurodollars.

2007 the debt crisis fully engages, the oldest and largest Wall Street firms are facing insolvency.

2008 Bernanke fires up the Quantitative easing printing press creating 600 billion with keypunch entries to buy bad bank debt  and cauterize the sub-prime mortgage hemorrhages for the “to big to fail” institutions.

With the creation of 100″s of billions inflation began rising but BLS.GOV CPI revision magic  contains it.

By 2009 the US Government completely disengaged from trying to make the tough policy decisions that would be in the best long term interest of the United States and opted to use the “Quantitative  Easing” printing press and BLS.GOV revision magic to give the World the impression the US economy was on the right track.

June 2009 the “Great Recession” officially ends and “economic recovery” begins

True inflation versus BLS.GOV fiction

The CPI was originally created in 1919 to help businesses, individuals and the government adjust their financial planning for the impact of inflation. The first round of major “revisions” to the CPI occurred in the late 70’s and early 80’s after the Federal Reserve and US government had exhausted all ethical options to contain US inflation since the US abandoned the gold standard in 1971.

In the decades that followed the BLS.GOV reporting system has increasingly succumbed to pressures from miscreant officials who have the intent of reducing US government debt service cost and all governmental expense increases that are tied to the official CPI rate (Military, Social Security, Government Employees and Welfare recipients)

The CPI now consists of more than 80,000 items in over 200 categories arranged into eight major groups, “Hedonic Quality Adjustments” are applied then the data is “weighted” to reflect a “more accurate” representation of inflation.

As this index was in part created to help government “adjust their financial planning for the impact of inflation” let’s match the BLS.GOV CPI inflation calculations between 1978-2015 to  actual totals for Federal, State, and Local Government spending

In 1978 total spending was $734,467.0 million

 1 Total Spending $734,467.0 million
 2 Pensions $114,391.6 million
 3 Health Care $66,243.2 million
 4 Education $127,181.0 million
5 Defense $130,939.0 million
 6 Welfare $70,465.9 million

With the BLS.GOV’s budget at 618.2 million annually one would expect the BLS.GOV  to produce fairly accurate numbers.

BLS.GOV calculations show that total spending between 1978 to 2015 should have increased by 1,935,489 million or +263.52%.

BLS.GOV inflation calculator

Screenshot_95

The actual increase was  5,627,678 million or +766.23%

2015 1978  Increase Percent
 1 Total Spending $6,362,145.20 $734,467.00 $5,627,678.20 766.23%
 2 Pensions $1,240,552.20 $114,391.60 $1,126,160.60 984.48%
 3 Health Care $1,357,831.00 $66,243.20 $1,291,587.80 1,949.77%
 4 Education $1,015,198.70 $127,181.00 $888,017.70 698.23%
 5 Defense $798,736.90 $130,939.00 $667,797.90 510.01%
 6 Welfare $466,372.50 $70,465.90 $395,906.60 561.84%

Source USgovernmentspending.com

Now let’s match the actual increases to gold

Average price of gold  from January 1976 to December 1978 = $155.28
Average price of gold from January 2013 to December 2015 = $1,278.46
Increase = $1,123.18
Percent increase =  723.32%

Summary

BLS.GOV calculations say the increase should have been +263.52%.
Actual increase +766.23%
Gold standard increase +723.32%

Screenshot_96
Source Federal Reserve

You can take nearly any period on anything from home prices, oil, food, college tuition stocks or funeral costs and the BLS.GOV calculations on this page will underestimate the actual increase by a significant amount.

The big difference

Current calculations try to measure the minimum cost of living.
Pre-1980 calculations measure a constant standard of living.

Blue = Pre 1980 CPI calculation methods (constant standard of living)
Red = Current current CPI calculation methods (minimum cost of living)

Screenshot_97.png
Source
Shadow Stats

My experience with US inflation

I run a family office from a tax free spec of an island 1,770 kilometers south east of Palm Beach Florida. As the head of a family office my job is the preservation and enhancement of family wealth I keep a close eye on expenditures to ensure a constant standard of living rather than a minimum standard of living.

Over the past 20+ years my family and I spend several months per year in the US, my family has purchased the same items, same amounts of food, alcohol, drugs, energy, resided in the same zip code and had the same household staff.

BLS.GOV inflation calculations put my increase over the 20 year period at 52.48%
My actual increase in cost of living was 142.58%

The Fed,’s Treasury.GOV and BLS.GOV’s motivation

If  inflation had been accurately reported since 1980 US debt service cost and the cost of all Federal  programs who’s increases are tied to the BLS.GOV CPI such as Social Security would have left the US government insolvent over a decade ago.

The spread between the Federal debt in red and tax receipt growth in green would be have been far wider a lot sooner.

Orange = BLS.GOV reported CPI
Purple = Federal debt service cost
Green = US Federal tax receipts
Red = Federal debt
Blue = Social Security

Screenshot_71Source Federal Reserve

As I see it US politicians long ago decided that they weren’t going to do something as unpopular as raising taxes,  or as responsible as cutting budgets to balance a budget when the BLS.GOV  can revise the CPI to generating trillions of dollars without having to get that pesky public or congressional approval.

This  kind of attitude might have balanced a budget in the short term but it didn’t, not only did politicians the Fed, US Treasury and BLS.GOV essentially steal money from depositors, Social Security Recipients and the providers of all governmental goods and services who’s increases are tied to the CPI politicians unconscionably escalated governmental spending.

End result a debt to GDP ratio of 105% closing in on the World War II all time high of 113%

Screenshot_50Source Federal Reserve

With revisions putting inflation near zero, deposit rates near zero and all increases tied to the “official CPI” near zero saving the US Treasury trillions of dollars budget deficits during economic stimulus still averaged 894 billion annually and remain above 400 billion.

Politicians, the Fed, US Treasury and BLS.GOV realize the revision well has finally run dry and there are only 4 options left

  1. Double taxes across the board
  2. Immediate and severe budget cuts across the board
  3. A combination much higher taxes and severe budget cuts
  4. Extremely aggressive dollar devaluation

Think of your self as a politician, we’re not talking about what’s best for the US in the long run,  we’re talking about your best interest in the long run and the “speaking fees” you can crank out after you leave office, Regan 1 million, Trump 1 million, Bill Clinton 450K, Hilary Clinton 200K, Gore 150K, Palin 100K?

Potential outcomes

1) Double taxes, well that’s not going to work everyone that’s making money who can grab their laptop and plug into the internet in tax free country will leave. Who will be left to pay your 100K to 1 million nightly “speaking fees” after you leave office.

Case in point British Virgin Islands. $2,000 for government fees, a medical exam, a plane ticket and in 11 hours or less your on white sandy beach,  if you don’t live the beach on you can drive to legally with a cocktail in your hand, once there order more as you bask in the sun. Example the British Virgin Islands

https://s0.wp.com/wp-content/themes/pub/twentyfifteen/js/html5.js

Source Federal Reserve

The other 175 million might not like that too much,  8.75 million (5% of the work force) are unemployed and the other 166.25 million (52% of the population) don’t have jobs cutting benefits and programs isn’t going to generate votes.

Screenshot_127
Source Federal Reserve

3) A combination much higher taxes and severe budget cut, well we no that a very big no go it would just piss off everyone and you wouldn’t make it to the primaries.

4) Extremely aggressive dollar devaluation, YES we have a winner, no tax hikes, no budget cuts, The Fed and BLS.GOV can take care of the dirty work and you’ll have time to meet your favorite “speaker” at a suite at the Hay-Adams , pay her, her 1 hour “speaking fee” and be able to be back at the mansion in Cleveland  Park to have dinner with the wife and kids.

What I  don’t know

  • Who will be running the United States in 2017 or the policies they’ll implement
  • The impact these policies will have on the market
  • When foreign investors will have had enough and liquidate US stocks, debt instruments and dollars  that are all currently trading near their highs.
  • The numbers the BLS.GOV will release to maintain the impression the US economy  is in “recovery” and on track or how the the market will react.

What I do know

The overall US economic numbers  are the worst in US history. They certainly do not support the representation that the “Great Recession” officially ended in 2009 and the US economy is in recovery. What they do show is “economic stimulus” for the US taxpayer, future generations of Americans and the US economy was  the most costly policy failure in US history.

The US now is facing the worst debt crisis in its history without the tax receipts to service the Federal debt service cost if rates “normalized” much less pay this debt down.

Green = US Federal tax receipts
Red = Federal debt
Purple = Federal debt service cost

Screenshot_111Source Federal Reserve

I know Non-US investors (like myself) now own US assets that are equivalent to 130% of the US GDP.

Screenshot_101
Non-US investors own over 40% of the total US Corporate Bonds and US Equities.

Screenshot_100

Non-US investors own over 55% of the marketable US Treasury debt

Screenshot_103
Source Council on Foreign Relations

I see the US equity markets now bouncing of record highs struggling to make higher highs.

Screenshot_104

Long term Treasury prices are near record highs with yields near record lows, instrument appreciation potential is nearly non existent.

Screenshot_107

Short term Treasuries same scenario

Screenshot_106

The dollar is coming off a 10 year high

Screenshot_108

Instrument price and currency risk for non US investors (like myself) is more in one day than any annual potential price appreciation, dividends or yields.

The only reason I’ve held off selling is to capture instrument price appreciation definitely  not the dividend or interest income which are beyond pathetic.

Currently I can invest in 13 countries that have a higher credit ratings than the US, 18 that have the same or higher rating.

  • The combined GDP for these countries exceeds the US’s
  • Economic releases have proven to be more reliable
  • Most have upside currency appreciation potential greater than the USD
  • Many have the same or higher short term rates
  • Most have far higher academic  achievement for the youth that will be running their countries in the coming decades.

Unfortunate, harsh but true

Screenshot_54
Supporting Data

As I see it BLS.GOV and the Fed’s creditability is no longer in the toilet, it’s already been flushed.

The Fed with the help of the BLS.GOV keeps telling us there is no inflation in order to justify the low rates,  actual price increases tell me a completely different story.

Reality

Artificially low inflation justifies artificially low rates stripping savers and the free market economy of trillions of dollars to save the US Treasury the same trillions, not stimulate the economy.

Artificially low inflation

  • Justifies stripping Social Security recipients of much needed cost of living increases removing trillions more from the economy to save  the  US Treasury the same trillions in cost of living increases, not to stimulate the economy.
  • Saves the US Treasury trillions more in in every governmental expenditure increase that is tied  to the BLS.GOV CPI, not stimulate the economy.

I think is should be pretty clear Economic stimulus was for the US Treasury and Banks not the US taxpayer, their children or their children’s children that will be picking up the tab.

The Fed keeps telling us we’ll see 8 to 15, 0.25% rate hikes by December 2018 if they’re right the US would become insolvent by debt service cost alone if debt service increased at the same pace.

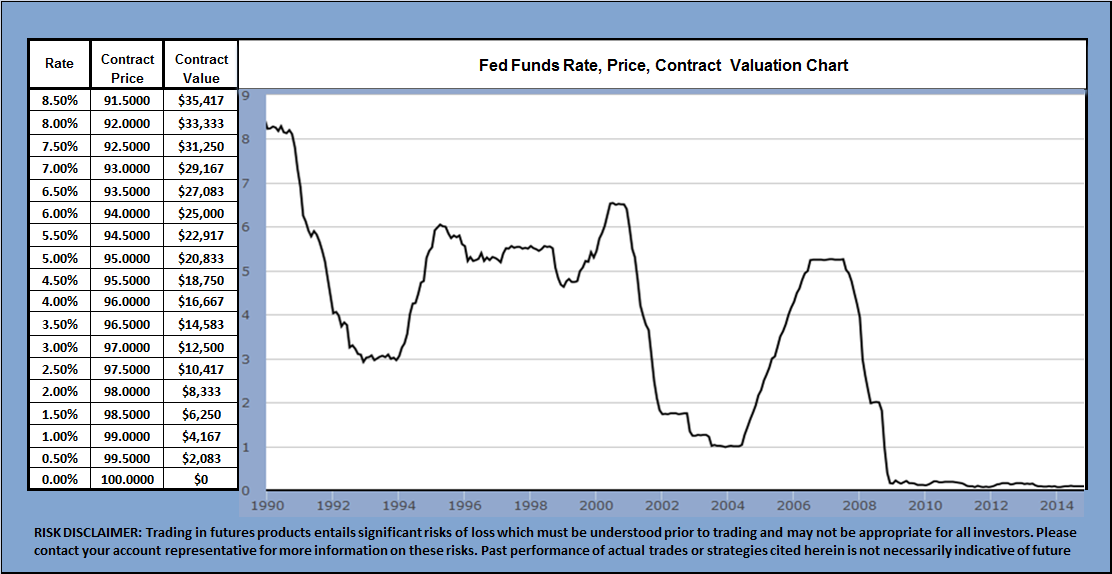
Where the world’s largest derivatives market is pricing rates and when

Market’s rate hike expectations from May 2011 through June 2016

A) May of 2011  3, 0.25% rate hikes by December 2018, the value of this spread was $1,875

B) January 2013  10, 0.25% rate hikes, value of this spread increased to $6,250.

C) Currently less than 2, 0.25% rate hikes are expected by the market by December 2018, spread value $1,250, a new low for the spread,  rate hike expectations and Fed creditability.

D)If the Fed had creditability with the market the spread would be trading closer to 2.00 to 2.50 position value $6,250, not below 0.50 position value $1,250.

Screenshot_110
Click here to monitor the Dec 2016 Dec 2018 spread current 0.32

Metals are telling us the same

Platinum versus gold; In short platinum although 9 times more scarce than gold is an industrial metal, when the market is optimistic about industry and the economy platinum sells at a premium to gold, when the market believes the economy will continue to be in the sewer platinum sells at a discount to gold, the more pessimistic the market the deeper the discount platinum sells to gold, we’re near all time low with platinum selling at over a   $3oo discount to gold.

Screenshot_130
Click here to monitor this spread currently at -$326.70

There are countless other spreads and indicators I track and they all are basically telling me the same thing,  , that mother of all US asset and US dollar “corrections” is on the horizon.

Dollar devaluation is already in play

After the sub-prime meltdown the Fed, US Treasury and the BLS.GOV  chose to devalue the dollar but not before they could finance the largest amount of debt in history for the longest period of time in history at the lowest rates in history.

How

When short term rates dropped to near zero any depositors desperate for any interest income at all were “sucked into” longer dated durations (5+ years)

As these investors shifted from shorter to longer dated durations for higher rates the Fed contained higher rates on these longer dated durations using strategies like the maturity extension program.

It’s taken the Fed, BLS.GOV and US Treasury  over 7 years to accomplish debt with an  average duration held greater than 5 years at and average interest paid less than 2.75% taxable.

Whatever happens to interest rates during the next 5 years as the dollar devalues US Debt service cost will remain  relatively constant. 

As the debt and equity markets struggle to make higher highs currency and instrument risk is more in one day than annual yields, dividends or asset appreciation potential.

Should the US debt and equity markets fail to make a significant higher high prior to China’s currency being recognized by the IMF as a world reserve or the US elections in November,  Non US investors like myself will start aggressively liquidating US debt, equities and dollars and establish net new short positions in US markets.

Non US investors already have homes lined up for the proceeds of US asset and US dollar sales  in any of the 13 countries that have a higher debt ratings than the US,  most have the same or higher yields, most have better currency appreciation potential than the USD as it sells off from its 10 year high.

Domestic investors trying to preserve their wealth will join in on the selling as the market “corrects” many will establish net new outright shorts.

Selling will intensify, additional shorts will enter the market accelerating the move lower.

The Fed and US politicians will blame the selloff in stocks, debt instruments and the dollar on Non US investor selling, in part they will be correct.

They’ll focus the blame on China as Chinese investors sell US debt and  US dollars for  Renminbi after the Renminbi officially comes on line as a “free floating”  world reserve currency this October.  Chinese investors will take their money home to an appreciating currency, earning a higher interest rate in an economy that according to the World Bank will be larger then the US economy by 2019.

The US US Treasury, Fed and BLS.GOV will have China to blame for the mess they created

When the dollar devalues by more than 25% the Fed will have the excuse they need to fire up the quantitative easing printing press with tenacity creating trillions more dollars with keypunch entries backed by no tangible asset or income flow to intervene and cauterize the market’s hemorrhage.

The creation of trillions more dollars will eventually be inflationary once these trillions “trickle down” into the economy.

As the dollar devalues as a result of inflation the prices of Gold and all other tangible assets (including shares) will increase.

True inflation will rise above 10%,  it could potentially rival the old high of 14.8%, I don’t know. What I do know and history has proven is when you increase the amount of money in circulation in any economy chasing after the same amount of goods and services prices rise.

The “official” BLS.GOV inflation will rise but remain dramatically below true inflation

Rates will rise but still be below BLS.GOV reported inflation and dramatically below true inflation. ( = negative rates of return and loss of true wealth for savers)

Incomes will rise but not nearly as quickly as true inflation( = declining lifestyle, sost of living versus constant standard of living)

Tax receipts will increase proportionally  as the prices of goods and services rise. In theory you could have twice the amount of US dollars in circulation chasing after the same amount of goods and services doubling prices and increasing tax revenue by 100%.

As the majority of the current US debt is fixed at the lowest rates in history for the longest period of time in history US debt service cost will not rise as dramatically as true inflation and potentially remain below 1/2 a trillion per year.

End result

  • Potentially twice the tax receipts generated by high inflation.
  • A relatively constant debt service cost because s the majority of US debt is fixed
  • The same savers who have been stripped of trillions of dollars by the largest negative rates of return in history for the longest period of time in history are about to have their buying power of their remaining savings in US debt and dollars cut in half all to save the Treasury.GOV the same trillions.

During the dollar’s devaluation the BLS.GOV will continue to misrepresent inflation is dramatically lower than actual inflation to contain debt service cost on new issues that need to be sold to finance future deficit spending,  maturing issues that need to be refinanced and contain the cost on all other governmental expenses whose increases are linked to the official BLS.GOV CPI rate.

The damage will be severe to NON US investors no smart enough to get out as they own approximately 60% of all marketable US Treasury debt and have dollar devaluation exposure against their home currencies as the dollar tanks.

The US will survive but lose a great deal of creditability and face additional debt downgrades making it more difficult if not impossible to market new issues to foreign investors.

China’s GDP will surpass US GDP

The ratio between the growth in tax receipts relative to the national debt will improve dramatically from current levels while growth in debt service cost trickle slowly higher.

More money, relatively constant debt service cost

Green = US Federal tax receipts
Red = Federal debt
Purple = Federal debt service cost

Screenshot_111Source Federal Reserve

I see no other out for the US Treasury

Enough of the bad news

The good news is bad news generates major market moves and powerful trends, it’s going to be a fun year for traders who are on their game and have strategies in place to capture the major market moves.

Time to brush on the sectors you have forgotten about,  your shorting and collar strategies. Metals are sure to shine, debt instruments look like they be a downer (rates higher) and we should have the opportunity to pick up our favorite shares at much better prices after the selling hemorrhage stalls.

Few of my favorite stocks and ETFs to trade (both short and long)

  • Apple (NASDAQ:(AAPL)
  • NYSE, Bank of America Corporation(BAX)
  • Microsoft (NASDAQ:MSFT)
  • Alphabet ([[GOOG]], [[GOOGL]])
  • Pfizer (NYSE:PFE)
  • Cisco (NASDAQ:CSCO)
  • Goldman Sachs (NYSE:GS)
  • Moody’s (NYSE:MCO)
  • Oracle (NYSE:ORCL)
  • AT&T (NYSE:T)
  • AbbVie (NYSE:ABBV)
  • JPMorgan Chase (NYSE:JPM)
  • Baxter International Inc (BAX)
  • Bank of America Corporation (BAC)
  • General Electric Company (GE)
  • SPDR S&P 500 Trust ETF (SPY)
  • ARCA, iShares MSCI Emerging Markets ETF (EEM)
  • ARCA, SPDR S&P Metals and Mining ETF (XME)
  • ARCA, Pfizer Inc. (PFE)
  • Apple Inc. (AAPL)
  • SPDR Gold Trust ETF (GLD)
  • ARCA, iPath S&P 500 VIX Short-Term Futures ETN (VXX)
  • ARCA, Market Vectors Gold Miners ETF (GDX)
  • ARCA, Ford Motor Company (F)
  • Financial Select Sector SPDR ETF (XLF)
  • ARCA, iShares China Large-Cap ETF (FXI)
  • ARCA, Shares Russell 2000 ETF (IWM) – NYSEARCA,
  • SPDR Gold Trust GLD
  • COMEX Gold Trust IAU
  • Physical Swiss Gold Shares SGOL
  • DB Gold Fund DGL
  • DB Gold Double Long ETN DGP
  • UltraShort Gold GLL
  • Gold Trust OUNZ
  • Ultra Gold UGL
  • DB Gold Double Short ETN DZZ
  • 3x Long Gold ETN UGLD
  • DB Gold Short ETN DGZ
  • 3x Inverse Gold ETN DGLD
  • Gartman Gold/Yen ETF GYEN
  • Gartman Gold/Euro ETF GEUR
  • E-TRACS UBS Bloomberg CMCI Gold ETN UBG
  • X-Links Gold Shares Covered Call ETN GLDI

Derivatives

The following exchanges can provide additional information

CME Group US JSE South Africa SHFE China
NASDAQ OMX US ASX Australia Zhengzhou China
TMX Canada JPX Japan NSE India
Intercontinental UK US Simex Singapore Moscow Exchange
Eurex Germany HKEX Hong Kong DME Dubai
BM&F Bovespa Brazil DCE China DCCC Dubai

I’ll be writing follow ups providing specific strategies

Volatility will be high, trade with the trend, when possible use option collars to define your risk on trades and for the duration of the trading period.

Peter Knight

Click here for contact details

x


RISK DISCLOSURE STATEMENT

PROGRAM AVAILABILITY IS DEPENDENT ON YOUR COUNTRY OF RESIDENCY AND FINANCIAL STATUS

PAST RESULTS ARE NOT NECESSARILY INDICATIVE OF FUTURE RESULTS. EXAMPLES OF HISTORIC PRICE MOVES OR EXTREME MARKET CONDITIONS ARE NOT MEANT TO IMPLY THAT SUCH MOVES OR CONDITIONS ARE COMMON OCCURRENCES OR ARE LIKELY TO OCCUR.

HYPOTHETICAL PERFORMANCE RESULTS HAVE MANY INHERENT LIMITATIONS, SOME OF WHICH ARE DESCRIBED BELOW. NO REPRESENTATION IS BEING MADE THAT ANY ACCOUNT WILL OR IS LIKELY TO ACHIEVE PROFITS OR LOSSES SIMILAR TO THOSE SHOWN IN FACT, THERE ARE FREQUENTLY SHARP DIFFERENCES BETWEEN HYPOTHETICAL PERFORMANCE RESULTS AND THE ACTUAL RESULTS SUBSEQUENTLY ACHIEVED BY ANY PARTICULAR TRADING PROGRAM. ONE OF THE LIMITATIONS OF HYPOTHETICAL PERFORMANCE RESULTS IS THAT THEY ARE GENERALLY PREPARED WITH THE BENEFIT OF HINDSIGHT.

IN ADDITION, HYPOTHETICAL TRADING DOES NOT INVOLVE FINANCIAL RISK, AND NO HYPOTHETICAL TRADING RECORD CAN COMPLETELY ACCOUNT FOR THE IMPACT OF FINANCIAL RISK IN ACTUAL TRADING. FOR EXAMPLE, THE ABILITY TO WITHSTAND LOSSES OR TO ADHERE TO A PARTICULAR TRADING PROGRAM IN SPITE OF TRADING LOSSES ARE MATERIAL POINTS WHICH CAN ALSO ADVERSELY AFFECT ACTUAL TRADING RESULTS. THERE ARE NUMEROUS OTHER FACTORS RELATED TO THE MARKETS IN GENERAL OR TO THE IMPLEMENTATION OF ANY SPECIFIC TRADE PROGRAM WHICH CANNOT BE FULLY ACCOUNTED FOR IN THE PREPARATION OF THE HYPOTHETICAL PERFORMANCE RESULTS AND ALL OF WHICH CAN ADVERSELY AFFECT ACTUAL TRADING RESULTS.

BID/ASK SPREADS, BROKERAGE COMMISSION, CLEARING, EXCHANGE AND REGULATORY FEES WILL HAVE AN ADVERSE IMPACT ON THE NET OVERALL PERFORMANCE OF YOUR ACCOUNT. PRIOR TO MAKING A DECISION TO PARTICIPATE IN ANY INVESTMENT MAKE SURE YOU FULLY UNDERSTAND THE FEES ASSOCIATED WITH TRADING.

THE INFORMATION PROVIDED IN THIS REPORT CONTAINS RESEARCH, MARKET COMMENTARY AND TRADE RECOMMENDATIONS. YOU MAY BE SOLICITED FOR AN ACCOUNT BY ONE OF OUR REPRESENTATIVES OR EMPLOYEES. IT SHOULD BE KNOWN THAT THE REPRESENTATIVES OF OUR FIRM MAY TRADE FUTURES AND OPTIONS FOR THEIR OWN ACCOUNTS OR THOSE OF OTHERS. DUE TO VARIOUS FACTORS (SUCH AS MARGIN REQUIREMENTS, RISK FACTORS, TRADING OBJECTIVES, TRADING INSTRUCTIONS, TRADING STRATEGIES, AND OTHER FACTORS) SUCH TRADING MAY RESULT IN THE LIQUIDATION OR INITIATION OF FUTURES OR OPTIONS POSITIONS THAT DIFFER FROM THE OPINIONS AND RECOMMENDATIONS FOUND IN THIS REPORT.

PAST PERFORMANCE IS NOT NECESSARILY INDICATIVE OF FUTURE PERFORMANCE. THE RISK OF LOSS IN TRADING FUTURES CONTRACTS OR COMMODITY OPTIONS CAN BE SUBSTANTIAL, AND THEREFORE INVESTORS SHOULD UNDERSTAND THE RISKS INVOLVED IN TAKING LEVERAGED POSITIONS AND MUST ASSUME RESPONSIBILITY FOR THE RISKS ASSOCIATED WITH SUCH INVESTMENTS AND FOR THEIR RESULTS.

YOU SHOULD CAREFULLY CONSIDER WHETHER SUCH TRADING IS SUITABLE FOR YOU IN LIGHT OF YOUR CIRCUMSTANCES AND FINANCIAL RESOURCES.

Trading 3 Month Rates Higher

Instrument

1) 3 month deposit contracts (futures symbol GE) are traded through the world’s largest dollar volume exchange group the CME.

2) Daily volume is more than 1.5 million contacts, open interest over 11 million exceeding the S&P, gold and crude oil combined. Click here for contract specifications, quotes, volume and open interest here for what this rate is and how it’s set.

3) To convert the contract price into the rate it represents

Take 100.00 – the contract price = the rate

100.00 – a contract price of 98.50 = a rate of 1.50%
100.00 – a contract price of 97.50 = a rate of 2.50%
Each 0.01 change in price = a $25.00 change in contract value

4) Trading this rate higher requires a short position as the rate moves higher the contract price falls to reflect the increase in rate.

5) Fed guidance on where rates will be and when

Click here for the Fed’s site, FOMC meeting schedule, all statements and all press conference videos
Click here for the Chicago Mercantile Exchange’s “Countdown to Higher Rates”
Click here for a 2 minute Fed Chair Yellen video telling you where the Fed sees rates and when.

Two simple trades

6) In the first example below we’re short the December 2017 (GEZ17) at 98.60, the rate the contract price represents is 1.60%, contract value $4,000, if the Fed is right about rates the contract price will fall to 96.50 and increase in value from $4,000 at 98.60 to $8,750 at 96.50.

7) Click here to enlarge the December 2017 3 month rate, price, valuation chart below
Vertical column 1 = rate, 2 = contract price, 3 = contract value

8) To experiment with any potential outcome for this trade.

In this example we’re establishing a long term trade with no hedge

Click here and open the risk/reward spreadsheet, once it opens enable it
Click here for December 2017 (GEZ17) quotes and charts

9) How to use the risk/reward spreadsheet

Enter any contract price in cell B-3
C-3 shows the rate the contract price represents
D-3 initial investment
E-3 Net profit or loss
F-3 Net liquidating value

10) If 3 month rates go to and remain at 0.00%

Enter 100.00 in cell B-3
Net profit or loss -$81,250.00 shows in cell E-3
Net liquating value $18,250.00 shows in cell F-3

11) If the Fed’s projections for rates are right between now and December 2017

Enter 96.50 in cell B-3
Net profit or loss shows in cell E-3 +$93,750.00
Net liquating value $193,750.00 shows in cell F-3

In the second example we’re using a hedged strategy

12) Click here to open the 3 month December 2017 risk/reward spreadsheet (hedged)

13) If rates go to and remain at 0.00%

Enter 100.00 in cell B-3
Net profit or loss shows in cell E-3, -$32,847.75
Net liquating value $67,156.25 shows in cell F-3

14) If the Fed is right about rates

Enter 96.50 in cell B-3
Net profit or loss shows in cell E-3, +$109,343.75
Net liquidating value $209,343.75 shows in cell F-3

Rates will rise over the next 2 ¼ years either from economic recovery or deteriorating Fed/US treasury credibility.

If you have any questions call or email

Regards,
Peter Knight

—————————————————————-

Privacy Notice

Disclosure

Debt Monetization is the only out for the US

If rates “normalized” over 50% of all US tax receipts would be consumed by debt service cost alone. Us deficits would be equal too or higher than at the height of the “great recession”

If the CPI was calculated using BLS.GOV 1980 inflation calculation methods over 90% of all tax receipts would be consumed by debt service cost. During “economic stimulus” the US national debt went up by 93% while tax receipts only increased by 28% https://research.stlouisfed.org/fred2/graph/?graph_id=239672&category_id

Screenshot_1107What I see on the horizon.

1) The Fed will raise rates in 2015 by 0.15% on the first hike expanding the top end of the Fed funds target range from 0.25% to 0.40%.

2) Each additional hike will be 0.10% as I believe 0.25% is far too aggressive from current levels. 

3) When the impact of higher rates finally engages I believe we’ll see a hard short term sell off in stocks and US Treasuries.

4) The Fed then will have the justification they need for more QE (creating trillions with keypunch entries backed by no tangible asset or income flow) to further their objective to monetize US debt

5) Dollar devaluation against tangible assets engages (true inflation) that will not be able to be contained by BLS.GOV “hedonic quality adjustments” or “substitution” revisions or omission that that are “too volatile to include” in the released CPI.

6) As the prices of goods and services rise tax revenue rises with it. There is a direct correlation between M1 (money supply or the creation of money) and tax receipts see this Fed chart https://research.stlouisfed.org/fred2/graph/?graph_id=239787

Screenshot_1093

7) The majority of US debt is now fixed in 10+ year Treasuries (debt service /national debt) see this US Treasury page http://www.treasury.gov/about/budget-performance/budget-in-brief/Documents

Screenshot_1094

8) National debt https://research.stlouisfed.org/fred2/graph/?graph_id=239780

Screenshot_1105

9) Average yield 2.52%, indicates and average duration of 10+ years http://www.bloomberg.com/markets/rates-bonds/government-bonds/us

Screenshot_1095

10) End result debt service cost will remain constant over the next 10+ years on the current 18+ trillion in debt with more tax receipts generated by inflation to service the FIXED debt service cost.

Treasury objective to close the the gap between debt and tax receipts see https://research.stlouisfed.org/fred2/graph/?graph_id=239672&category_id=

Screenshot_1096

11) Further deterioration of US debt credibility will engage, more US debt downgrades are in sight resulting in higher rates that the Fed will not be able to control by creating more QE trillions backed by nothing with keypunch entries.

12) 12 countries now have higher debt ratings than the US, most have the same or higher rates, liquidity is respectable and most have better currency appreciation potential see https://en.wikipedia.org/wiki/List_of_countries_by_credit_rating

Screenshot_1097

13) Currently currency & instrument risk for a non US investor holding a US Treasury is more in one day than annual yields. Below US debt held by non US investors. https://research.stlouisfed.org/fred2/graph/?graph_id=239766&category_id= 

Screenshot_1098

14) As the US dollar comes off its 10 year high.  https://research.stlouisfed.org/fred2/graph/?graph_id=240375&category_id=

Screenshot_1099

15) Foreign liquidation of 6+ trillion in US debt/US dollars owned by non US investors will aggressively engage https://www.nationalpriorities.org/campaigns/us-federal-debt-who/

Screenshot_1100

16) The Fed will create more money using the QE printing press to contain the hemorrhage. https://research.stlouisfed.org/fred2/graph/?graph_id=249277

Screenshot_1101

17) The Fed and Treasury will have achieved their objective

18) Debt service cost on the current 18.1 trillion will remain fixed for 10+ years at 2.57%.

19) Tax receipts could potentially double from true inflation and dollar devaluation.  https://research.stlouisfed.org/fred2/graph/?graph_id=239779&updated=1372

Screenshot_1102

20) It has to spark some thought for the true motivation behind QE (creating trillions of dollars with keypunch entries) and the “maturity extension program” (the Federal Reserve buying trillions of long term debt to force rates to artificial and historic despite the lowest credit rating and worst economic fundamentals in our lifetimes)

Guidance

21) Reliable US interest rate guidance from either the US Treasury or Federal Reserve is hard to find. The US Treasury doesn’t feel the need, the Fed is an unaudited private bank and doesn’t have to, any guidance from the Fed should be considered a “gift” according to Fed officials.

22) The US Treasury provides little to no guidance see http://search.treasury.gov/search?utf8=%E2%9C%93&sc=0&query=rate+hikes&m=&affiliate=treasury&commit=Search

23) Last and lowest rate guidance from the Fed on where the Fed sees rates and when https://peterknightadvisor.wordpress.com/2015/04/01/in-10-minutes-learn-how-to-capture-the-first-leg-higher-in-rates/

24) Fed policy, meeting schedule, statements and press conference videos http://www.federalreserve.gov/monetarypolicy/fomccalendars.htm

25) You can also monitor where the CME futures market sees the Fed funds rate and when through September 2018 http://www.cmegroup.com/trading/interest-rates/stir/30-day-federal-fund_quotes_globex.html

Screenshot_1103

26) To convert the contract price into the rate is represents take 100.00 – the contract price = the rate

Example 100.00 – the December 2017 delivery price of 98.66 = a market expected rate of 1.34%

Trading this rate higher requires a short position each 0.01 change in price = $41.67

Current market expectations for December 2017 1.3450% contact value $5,604
Fed expectations for December 2017 3.25% contract value $13,541

The difference from where the market is pricing the Fed funds rate versus where the Fed is pricing the Fed funds rate per contact is currently $7,904

In other words if the Fed is right about the rate they set it represents an increase in contract value of +141.63%

27) Using the December 2016 delivery http://www.cmegroup.com/trading/interest-rates/stir/30-day-federal-fund_quotes_globex.html

28) Current position short December 2016 delivery (no hedge) if you are a client contact me for the hedge strategies with the highest return on risk.

29) Click here to enlarge the December 2016 rate, price valuation chart below.

Screenshot_1106

30) Instructions on how to experiment with any potential outcome for this trade.

31) Click here to open the December 2016 delivery risk/reward spreadsheet

32) Instructions on how to experiment with any potential outcome for this trade.

Quotes are linked in cell B-1,
Enter any price for the Fed funds rate in cell B-2
The rate the price represents will show in cell C-2
Net profit or loss will show in cell E-2
Investment amount can be changed in cell D-2
Deposit per contract in cell G-3

33) For Fed confirmation on this trade as to where the Fed sees the rate they set and when

For additional information see https://peterknightadvisor.wordpress.com/2015/09/04/26927/

If you’d like to open an account

35)  Open with any clearing and Exchange Member over $100,000
36)  The world’s largest dollar volume exchange group

37)  How your funds are protected working with a member firm
38)  CME videos

If you have any questions contact me

If you are a client and would like the current deliveries and hedged strategies that have the highest return on risk contact me 24/7

Regards,
Peter Knight


RISK DISCLOSURE STATEMENT

PROGRAM AVAILABILITY IS DEPENDENT ON YOUR COUNTRY OF RESIDENCY AND FINANCIAL STATUS

PAST RESULTS ARE NOT NECESSARILY INDICATIVE OF FUTURE RESULTS. EXAMPLES OF HISTORIC PRICE MOVES OR EXTREME MARKET CONDITIONS ARE NOT MEANT TO IMPLY THAT SUCH MOVES OR CONDITIONS ARE COMMON OCCURRENCES OR ARE LIKELY TO OCCUR.

HYPOTHETICAL PERFORMANCE RESULTS HAVE MANY INHERENT LIMITATIONS, SOME OF WHICH ARE DESCRIBED BELOW. NO REPRESENTATION IS BEING MADE THAT ANY ACCOUNT WILL OR IS LIKELY TO ACHIEVE PROFITS OR LOSSES SIMILAR TO THOSE SHOWN IN FACT, THERE ARE FREQUENTLY SHARP DIFFERENCES BETWEEN HYPOTHETICAL PERFORMANCE RESULTS AND THE ACTUAL RESULTS SUBSEQUENTLY ACHIEVED BY ANY PARTICULAR TRADING PROGRAM. ONE OF THE LIMITATIONS OF HYPOTHETICAL PERFORMANCE RESULTS IS THAT THEY ARE GENERALLY PREPARED WITH THE BENEFIT OF HINDSIGHT.

IN ADDITION, HYPOTHETICAL TRADING DOES NOT INVOLVE FINANCIAL RISK, AND NO HYPOTHETICAL TRADING RECORD CAN COMPLETELY ACCOUNT FOR THE IMPACT OF FINANCIAL RISK IN ACTUAL TRADING. FOR EXAMPLE, THE ABILITY TO WITHSTAND LOSSES OR TO ADHERE TO A PARTICULAR TRADING PROGRAM IN SPITE OF TRADING LOSSES ARE MATERIAL POINTS WHICH CAN ALSO ADVERSELY AFFECT ACTUAL TRADING RESULTS. THERE ARE NUMEROUS OTHER FACTORS RELATED TO THE MARKETS IN GENERAL OR TO THE IMPLEMENTATION OF ANY SPECIFIC TRADE PROGRAM WHICH CANNOT BE FULLY ACCOUNTED FOR IN THE PREPARATION OF THE HYPOTHETICAL PERFORMANCE RESULTS AND ALL OF WHICH CAN ADVERSELY AFFECT ACTUAL TRADING RESULTS.

BID/ASK SPREADS, BROKERAGE COMMISSION, CLEARING, EXCHANGE AND REGULATORY FEES WILL HAVE AN ADVERSE IMPACT ON THE NET OVERALL PERFORMANCE OF YOUR ACCOUNT. PRIOR TO MAKING A DECISION TO PARTICIPATE IN ANY INVESTMENT MAKE SURE YOU FULLY UNDERSTAND THE FEES ASSOCIATED WITH TRADING.

THE INFORMATION PROVIDED IN THIS REPORT CONTAINS RESEARCH, MARKET COMMENTARY AND TRADE RECOMMENDATIONS. YOU MAY BE SOLICITED FOR AN ACCOUNT BY ONE OF OUR REPRESENTATIVES OR EMPLOYEES. IT SHOULD BE KNOWN THAT THE REPRESENTATIVES OF OUR FIRM MAY TRADE FUTURES AND OPTIONS FOR THEIR OWN ACCOUNTS OR THOSE OF OTHERS. DUE TO VARIOUS FACTORS (SUCH AS MARGIN REQUIREMENTS, RISK FACTORS, TRADING OBJECTIVES, TRADING INSTRUCTIONS, TRADING STRATEGIES, AND OTHER FACTORS) SUCH TRADING MAY RESULT IN THE LIQUIDATION OR INITIATION OF FUTURES OR OPTIONS POSITIONS THAT DIFFER FROM THE OPINIONS AND RECOMMENDATIONS FOUND IN THIS REPORT.

PAST PERFORMANCE IS NOT NECESSARILY INDICATIVE OF FUTURE PERFORMANCE. THE RISK OF LOSS IN TRADING FUTURES CONTRACTS OR COMMODITY OPTIONS CAN BE SUBSTANTIAL, AND THEREFORE INVESTORS SHOULD UNDERSTAND THE RISKS INVOLVED IN TAKING LEVERAGED POSITIONS AND MUST ASSUME RESPONSIBILITY FOR THE RISKS ASSOCIATED WITH SUCH INVESTMENTS AND FOR THEIR RESULTS.

YOU SHOULD CAREFULLY CONSIDER WHETHER SUCH TRADING IS SUITABLE FOR YOU IN LIGHT OF YOUR CIRCUMSTANCES AND FINANCIAL RESOURCES.

Review Links

1)Reports

171) Deposit rates relative to BLS.GOV inflation
170) US China Trade War Update
169)
Interpreting the U.S. Bond Rally

168) Trading Rates Higher 201806
167)
Identifying The Trend Change In Gold
166)
US Economic Reality 2000-2018
165) Performance summary
164) Track us trading rates higher through June 2018
163) Platinum Gold Spread
162) SeekingAlpha 20 November 2017 Update
161) Trading rates Higher March 2017
160) SeekingAlpha 15 November 2015 Recommendations
159) Collars and Deltas
158 )Educational videos
157) Segregated Accounts
156) Trading Apple Using Defined Risk Strategy
155) +98.63% trading US short term interest rates higher, 13 March 2017
154) +80.16% Trading Interest Rates Higher, 19 January 2017
153) Common Mistakes System Traders Make
152) The pounding in the Pound is the US dollar next?

151) Capturing The Move Higher In The Fed Funds Rate
150) Trading with Collars
148) Market Versus Fed Expectations For Rates
147) 1933-1939 Versus 2008-2016
146) What is Banqiao Banking Policy? 
145)  US Consumer Price Index Fact or Fiction?
144) Oil: Trend Insights from Futures and Options
143)  Who’s right the Market or the Fed?
142)  Recession slang
141)  The Sad Story of the Hunt Brothers
140)
  The only solution left for US Treasury debt crisis
139) 
Strategy to deal with rising rates over the next 36 months
138)  Last Fed guidance as to where the Fed sees rates and when
137)  FOMC meeting schedule to set US rates
136)  The last tightening cycle 2004-2006 1.00% to 2006 5.25%
135)  What the Fed Funds rate is and its history
134)  Capture the move higher in the Fed Funds rate
133)  What the 3 month rate is and its history
132)  Capture the move higher in 3 month rates
131)  Hedging Treasury Risk
130) Trading the Fed’s defined range in the Fed funds rate
129) The US versus China using the Fed’s numbers
128) How China’s race to reserve currency status will rock markets
127) The Chinese currency to become more important globally
126) China: Renminbi/Yuan becomes an IMF reserve currency
125) Bernanke and the “Great Recession”
124) Why U.S. inflation is so “contained”
123) Trading the S&P 500 using collars
122) Countdown to higher rates
121) CME interest rate contracts
120)
Current interest rate news last 24 hourslast weeklast month

Risk Reward Spreadsheets

108) Gold Collar Spreadsheet
109) EUR Collar Spreadsheet
110) SP 500 Collar Spreadsheet
111)
Option Write Spreadsheets
110) Capturing the move higher in rates Short Dec 2016 – 99.46

109) Trading the Fed Funds rate
108) Fed Funds Outright (no hedge)
107) Fed Funds (no hedge) 100K
106) Fed Funds  (no hedge) 10K
105) Trading 3 month rates higher
104) 3 Month  (no hedge)
103) 3 Month put weighted vol spread
102) 3 Month vol spread Dec 2017
101) 3 Month vol bear spread no hedge Dec 2017
100) 3 Month GEH-M-Z-2016 Fed Funds ZQ-H 2016 10.05.2015

Fed Charts & Supporting Links

88) US deposit rates versus the CPI
87) US bank borrowing cost to lending rate
86) US annual budget deficits
85) US debt to tax receipt growth
84) US median priced home
83) US debt to GDP ratio
82) US trade deficits
81) Emergency purchases of US debt by the Federal Reserve
80) US debt to personal income ratio
79) US debt to employed population
78) US debt to hourly earnings
77) US mortgage delinquency
76) US debt to GDP ratio relative to China
75) US growth ratio relative to China
74) US trade deficits relative to China
73) USD against China’s currency (Renminbi)
72) US Versus China’s short term interest rates
71) Offshore Chinese Renminbi Market (CNH)
70) Chinese Renminbi/USD Futures
69) Chinese Renminbi/USD Quotes
69) US credit rating versus other countries
68) US Treasury debt held by non US investors
67) Treasury auction basics
66) US debt service cost to tax receipts
65) CPI using pre 1980 & 1990 calculations

64) CPI ABC chart
63) Current CPI ABC chart
62) Why inflation does not match the true CPI
61) US Debt, Tax receipts and CPI
60) Tax receipts. median home, M1, gold, CPI
59) The last tightening cycle
58) Fed funds contract valuation chart
57) Current Fed funds chart and all historical data
56) US FEDERAL DEBT 1966 to 2019
55)
US Debt service cost

54) Federal debt to debt service cost
53) Bloomberg Fed funds quotes
52) CPI using current calculation methods
51) CPI using the Fed 1990 calculation methods
50) BLS.GOV “official CPI
49) Federal debt, M1 and CPI

Resources

16) Chicago Mercantile Exchange rate commentary
15) CME interest rate contracts
14)  Videos
13)  Educational material
12)  Getting started CME
11)  Real-Time Trading Simulation
10)  Bloomberg Live

9)    Reuters
8)    Washington Post
7)    MSNBC
6)    CNN
5)    The Financial Times
4)    CBS Market Watch
3)    Current key rates
2)    Economic calendar
1)   
Review 2

Peter Knight
Advisor

Contact details


Privacy Notice

Disclosure


Hedging Treasury Risk –

If you’re stubborn about holding Treasuries with the pending rate hike and you or your manager doesn’t hedge downside risk you’ll have no one to blame but yourself.

Using an option collar provides protection by selling a call option against your position and using the collected premium to purchase a put option to define downside risk.

1) Benefits

Risk is defined on the trade and for the duration of the trading period

Loses will be limited when the Fed finally engages with rate hikes

If the market stays the same you’ve collected approximately as much time premium as you’ve purchased

2) How it works, start by checking the chart

Click here for a current chart

Screenshot_929

3) Check your ranges

To determine realistic risk reward levels consistent with the duration of the trade. In this example I’m trading the September 10 Year which goes off the board 21, August 2015 or 18 days from the 3 August 2015 entry.

Click here for current ranges

Screenshot_927

4) Establish your position.

Long the September T-Note at 127 26/32

Sell the 128 32/64th call against the long position collecting $335.94

Using the collected premium buy the 126 32/64th put paying $298.06

Screenshot_928

5) To experiment with any potential outcome for this trade

Click here to open the corresponding risk/reward spreadsheet, enable it, enter any price into cell C-2

6) Worst case scenario

Rates skyrocket, Treasuries sell off hard to 110 0/32nds for a loss in contract value of -17,812.50 or – 13.93% but because we’re hedged our loss was limited to -$1,266

Screenshot_924

7) To confirm

A) Enter 110 0/32 in cell C-2
B) Net loss shows in cell E-2
C) Net liquidating value shows in cell E-3

Screenshot_930

8) The market stays the same you’ve collected your credit premium of $47 plus your interest income.

A) Enter 127 26/32nds in cell C-2
B) Net loss shows in cell E-2
C) Net liquidating value shows in cell E-3

Screenshot_931

9) Rates move lower, Treasuries rally, the position is called away at a $734 profit plus your interest income and we can reestablish the position immediately.

A) Enter 2,000 in cell C-2
B) Net loss shows in cell E-2
C) Net liquidating value shows in cell E-3

Screenshot_932

For more advance traders we can write a put below the market for reentry where the only way we could be delivered a position is at a better price,  if the market never goes down to the strike we keep the premium.

Example the 127 put is nearly a full point below the market with a time decay of 0.06% per month or 7.24% annually (far more than the interest income)

If delivered a position you can collar it explained above

Or

You can write a call above the market for example 128 16/32 collecting 0.07% per month or 8.5% annually ,the only way the position can be called away from you is at a profit 0.54% or you were paid 0.7% for that month to sell it at a profit (in at 127 26/32nds out at 128 12/32nds).

Using this strategy the worst thing that will happen to you is you would own a bond that you would have bought or already owned anyway.

Contact me for more information on yield enhancement

These strategies can be traded in any liquid market, crude oil and grains have the highest premium currently relative to contract value.

Regards,
Peter Knight Advisor

—————————————————————-

Privacy Notice

Disclosure


Trading the S&P using collars –

An option option collar provides defined risk on a long or a short position by selling an option against your position and using the collected premium to purchase an option to protect your position to objectively define risk

1) Benefits

    • Risk is defined on the trade and for the duration of the trading period
    • The position cannot be stopped out
    • If the market stays the same you’ve collected approximately as much time premium as you’ve purchased
    • The only way the position can be called away is at a profit

2) Identify the current trend using a daily chart, the red red line exponential moving average 9 (EMA9) above the blue line (EMA18) trade long Red EMA9 below blue EMA18 trade short

Red EMA9 is below the Blue EMA 18, the S&P ready for a correction, establish your position with the trend.

Short the S&P at 2,094.50

Click here for a current chart

3) Check your ranges

Determine realistic risk reward levels consistent with the duration of the trade. In this example I’m trading the September S&P which goes off the board 18 September 2015 or 46 days from our 3 August 2015 entry.

Click here for current ranges

Screenshot_919

    • Sell the 2,060 put against the short position collecting $1,212.50
    • Using the collected premium buy the 2,115 call -$1,187.50

Screenshot_919 2

4) To experiment with any potential outcome for this trade

Click here to open the corresponding risk/reward spreadsheet, enable it, enter any price into cell C-2

5) Worst case scenario, the market rallies against your short position to 3,000

A) Enter 3,000 in cell C-2
B) Net loss shows in cell E-2
C) Net liquidating value shows in cell E-3

Screenshot_920

6) The market stays the same

A) Enter 2,094.50 in cell C-2
B) Net loss shows in cell E-2
C) Net liquidating value shows in cell E-3

Screenshot_921

7) The market sells off and the position is delivered at a profit

A) Enter 2,000 in cell C-2
B) Net profit shows in cell E-2
C) Net liquidating value shows in cell E-3

Screenshot_922

This strategy can be traded in any liquid market

Contact me with any questions


RISK DISCLOSURE STATEMENT

PROGRAM AVAILABILITY IS DEPENDENT ON YOUR COUNTRY OF RESIDENCY AND FINANCIAL STATUS

PAST RESULTS ARE NOT NECESSARILY INDICATIVE OF FUTURE RESULTS. EXAMPLES OF HISTORIC PRICE MOVES OR EXTREME MARKET CONDITIONS ARE NOT MEANT TO IMPLY THAT SUCH MOVES OR CONDITIONS ARE COMMON OCCURRENCES OR ARE LIKELY TO OCCUR.

HYPOTHETICAL PERFORMANCE RESULTS HAVE MANY INHERENT LIMITATIONS, SOME OF WHICH ARE DESCRIBED BELOW. NO REPRESENTATION IS BEING MADE THAT ANY ACCOUNT WILL OR IS LIKELY TO ACHIEVE PROFITS OR LOSSES SIMILAR TO THOSE SHOWN IN FACT, THERE ARE FREQUENTLY SHARP DIFFERENCES BETWEEN HYPOTHETICAL PERFORMANCE RESULTS AND THE ACTUAL RESULTS SUBSEQUENTLY ACHIEVED BY ANY PARTICULAR TRADING PROGRAM. ONE OF THE LIMITATIONS OF HYPOTHETICAL PERFORMANCE RESULTS IS THAT THEY ARE GENERALLY PREPARED WITH THE BENEFIT OF HINDSIGHT.

IN ADDITION, HYPOTHETICAL TRADING DOES NOT INVOLVE FINANCIAL RISK, AND NO HYPOTHETICAL TRADING RECORD CAN COMPLETELY ACCOUNT FOR THE IMPACT OF FINANCIAL RISK IN ACTUAL TRADING. FOR EXAMPLE, THE ABILITY TO WITHSTAND LOSSES OR TO ADHERE TO A PARTICULAR TRADING PROGRAM IN SPITE OF TRADING LOSSES ARE MATERIAL POINTS WHICH CAN ALSO ADVERSELY AFFECT ACTUAL TRADING RESULTS. THERE ARE NUMEROUS OTHER FACTORS RELATED TO THE MARKETS IN GENERAL OR TO THE IMPLEMENTATION OF ANY SPECIFIC TRADE PROGRAM WHICH CANNOT BE FULLY ACCOUNTED FOR IN THE PREPARATION OF THE HYPOTHETICAL PERFORMANCE RESULTS AND ALL OF WHICH CAN ADVERSELY AFFECT ACTUAL TRADING RESULTS.

BID/ASK SPREADS, BROKERAGE COMMISSION, CLEARING, EXCHANGE AND REGULATORY FEES WILL HAVE AN ADVERSE IMPACT ON THE NET OVERALL PERFORMANCE OF YOUR ACCOUNT. PRIOR TO MAKING A DECISION TO PARTICIPATE IN ANY INVESTMENT MAKE SURE YOU FULLY UNDERSTAND THE FEES ASSOCIATED WITH TRADING.

THE INFORMATION PROVIDED IN THIS REPORT CONTAINS RESEARCH, MARKET COMMENTARY AND TRADE RECOMMENDATIONS. YOU MAY BE SOLICITED FOR AN ACCOUNT BY ONE OF OUR REPRESENTATIVES OR EMPLOYEES. IT SHOULD BE KNOWN THAT THE REPRESENTATIVES OF OUR FIRM MAY TRADE FUTURES AND OPTIONS FOR THEIR OWN ACCOUNTS OR THOSE OF OTHERS. DUE TO VARIOUS FACTORS (SUCH AS MARGIN REQUIREMENTS, RISK FACTORS, TRADING OBJECTIVES, TRADING INSTRUCTIONS, TRADING STRATEGIES, AND OTHER FACTORS) SUCH TRADING MAY RESULT IN THE LIQUIDATION OR INITIATION OF FUTURES OR OPTIONS POSITIONS THAT DIFFER FROM THE OPINIONS AND RECOMMENDATIONS FOUND IN THIS REPORT.

PAST PERFORMANCE IS NOT NECESSARILY INDICATIVE OF FUTURE PERFORMANCE. THE RISK OF LOSS IN TRADING FUTURES CONTRACTS OR COMMODITY OPTIONS CAN BE SUBSTANTIAL, AND THEREFORE INVESTORS SHOULD UNDERSTAND THE RISKS INVOLVED IN TAKING LEVERAGED POSITIONS AND MUST ASSUME RESPONSIBILITY FOR THE RISKS ASSOCIATED WITH SUCH INVESTMENTS AND FOR THEIR RESULTS.

YOU SHOULD CAREFULLY CONSIDER WHETHER SUCH TRADING IS SUITABLE FOR YOU IN LIGHT OF YOUR CIRCUMSTANCES AND FINANCIAL RESOURCES.

Trading the Fed Funds rate higher through December 2016

Click here for what this rate is and how it’s set
Click here for the latest guidance on the where Fed sees this rate and when
Click here for the last 24 hours of rate news, here past week, here past month

1) Trading the Fed Funds rate from 0.54% higher between now and December 2016 ZQZ16

Click here to enlarge the December 2016 rate, price valuation chart below.

Screenshot_123

Instructions on how to experiment with any potential outcome for this trade.

2)  Click here and open the December 2016 delivery risk/reward spreadsheet, when the spreadsheet opens enable it.

A) Quotes are linked in cell B-1
B) Enter any price for the Fed funds rate in cell B-2
C) The rate the price represents will show in cell C-2
D) Investment amount can be changed in cell D-2
E) Net profit or loss will show in cell E-2
F) Net liquidation value will shoe in cell G-2
G) Deposit per contract can be changed in cell G-3
H) Contracts traded shows in cell H-19

3) Click here to enlarge the image below

Screenshot_124
This spreadsheet will allow you to experiment with any potential outcome for this trade using any investment amount or leverage. Contact me for other strategies with a higher return on risk trading any duration in any global interest rate market.

4) Where the market sees rates and when

The Fed Funds futures contract will give you excellent indication of what market expectations are for the Fed Funds rate to the 0.01% monthly all the way out to October 2018.

To convert the contract price into the rate it represents take 100.00 subtract the contract price = the rate.

Click here for current futures quotes

Screenshot_126

5) Where the Fed see’s rates and when

Market versus Fed expectations are entirely different; the last guidance the Fed gave was 3.2500% by December 2017.

6) Difference between market and Fed expectations

Click here to enlarge the valuation table below

Screenshot_125

7) Click here for supporting links,charts, videos, reports directly on the Fed’s website.

Screenshot_887

8) If you’d like to track additional interest rate positions send us a message or schedule an online review .

8.1) All US interest rate markets we trade 
8.2) European interest rates
8.3) Australian Interest rates
8.4) Educational videos and Links

Regards,
Peter Knight Advisor

—————————————————————-

Privacy Notice

Disclosure

The math on why U.S. inflation is so “contained” = Monetization –

1) The U.S. Treasuries problem

Currently each 1.00% increase in rates consumes 10% of total U.S. tax receipts.

Click here for the current Fed chart

Screenshot_848

2) If you’re in the 8% minority that believe the BLS.GOV CPI calculations are correct the average annual CPI during the “Great Recession” has been 1.58%

Click here for current BLS.GOV numbers

Screenshot_849

3) If you are in the 92% that currently do not give BLS.GOV inflation numbers creditability you’re supported by actual increases.

Screenshot_885

4) 1980 and 1990 inflation calculations also support the 92%

5) Click here for current charts and more information on 1980 & 1990 CPI calculations.

Using 1980 BLS.GOV calculation methods the inflation rate would be greater than 7.50%

Screenshot_851

6) Using 1990 BLS.GOV calculations the inflation rate would be near 4.00%

Screenshot_850

By the BLS.GOV massaging the CPI lower (as they have through their current revisions and “enhanced calculation methods”)  the BLS.GOV has saved the .GOV trillions in debt service costs and reduced all other cost increases that are tied to inflation.

7)  Where rates should be using current BLS.GOV inflation calculations if you are in the 8% minority that give them creditability.

The 40 year average for Treasury yields is 2.14% above the CPI, the current average Treasury rate is 2.37%

Click here for the current Fed chart and supporting historical data

Screenshot_852

8) If yields went back in line with the 40 year average above the CPI Treasury yields would increase from 2.37% to 3.72% for an increase in debt service cost from the current 430 billion to 675 billion annually

Debt service cost alone would consume 36% of total U.S. annual US tax receipts.

Click here for current debt service cost

Screenshot_853

9) Where rates would be relative to historical averages

If yields went back in line with their 40 year average the average Treasury rate would increase from 2.37% to 6.14%. Debt service cost would increase from 430 billion annually  to 1.117 trillion consuming 64% of all annual tax receipts.

Where rates would be using 1980 BLS.gov calculation methods for the CPI

The current CPI using 1980 calculations would currently be 7.57%.

Using the historical average Treasury yield above the CPI Treasury the average Treasury yield would rise to 9.71% increasing the debt service cost from 430 billion to 1.77 trillion consuming 97.25% of total US tax receipts.

Can you see why the BLS.GOV needs to massage the CPI numbers lower to bailout their parent company the .GOV?

10) Pre BLS.GOV revision magic

The CPI in orange,  debt in red, M1 in blue and tax receipts in green all move together.

Click here for the Fed chart and supporting historical data

Screenshot_856

11) Post BLS.GOV revision magic

You don’t have to be a Rhodes scholar to come to the conclusion the BLS.GOV’s inflation numbers would justify a name change for BLS.GOV to just BS.GOV.

Click here
for the current Fed chart and supporting historical data

Screenshot_854

12) During the “Great Recession” and “Economic Stimulus” the U.S achieved the worst credit rating and debt to GDP ratio in history.

Click here for the current Fed chart and all supporting historical data

Screenshot_857

13) The worst debt to tax receipt ratio in history

Click here for the current Fed chart and all supporting historical data

Screenshot_858

14) The worst debt to disposable income ratio in history

Click here for the current Fed chart and all supporting historical data

Screenshot_859

15) The worst debt to the employed population ratio in history.

Click here for the current Fed chart and all supporting historical data

Screenshot_860

16) The worst debt to hourly earnings ratio in history

Click here for the current Fed chart and all supporting historical data

Screenshot_861

17) The worst debt to the dollar index ratio in history

Click here for the current Fed chart and all supporting historical data

Screenshot_862

18) Nearly every ratio is far worse than pre “economic stimulus”

Many including myself  believe  “economic stimulus” has created a far greater problem for the U.S. economy than the one it was designed to solve.

19) Why rates will rise

What everyone seems to forget up until 2008 the market basically controlled Treasury rates not the Fed.

When a country like the US needed money to finance deficit spending it created debt instruments that were sold at auction with the buyers setting the rate at auctions based on a country’s debt rating, creditability and economic outlook.

20) Click here for Treasury auction basics.

From 2008-2014 the Fed created trillions of dollars backed by no tangible assets or income flow the buy the majority of all new issues (up to 85 billion per month) to force and hold rates at artificial and unsustainable lows (Quantitative Easing)

21) This essentially shut down free market Treasury auctions and the free market determining a fair rate.

Click here for the current Fed chart and all supporting historical data

Screenshot_863

22) To put this into proper perspective 85 billion per month is 1.020 trillion annually or an amount more than twice the national debt in 1971 the year the US abandoned the Gold Standard.

Click here for the current Fed chart and all supporting historical data

Screenshot_865

23) Buy forcing rates to artificial lows the Fed created the largest negative rates of return for the longest period of time in history for holders of US debt..

Fed policy striped these “savers” and the free market economy out of trillions of dollars to save the U.S. Treasury the same amount in debt service cost, note the yields below the CPI during “economic stimulus” = a negative rate of return.

Click here for the current Fed chart and all supporting historical price data

Screenshot_866

24) Meanwhile banks never lowered the prime from 3.25%, the same banks that created the problem were allowed to lock in the largest profit margins on their borrowing costs in history for the longest period of time in history, note the Fed Funds borrowing rate relative to the prime rate the spread is 3.15% or more than 50% higher than the historical average of 2.00%.

Click here for the Fed chart and all supporting historical data

Screenshot_867

25) The Fed’s theory was to increase money supply, lie about inflation (with the help of BLS.GOV) and helicopter Ben Bernanke would inflate the U.S out of the recession back into artificial and unsustainable prosperity.

Bernanke outlines what his game plan was well before he became the chairperson of the Federal Reserve in this speech “Deflation Making Sure It Doesn’t Happen Here”

26) Click here for this speech posted on the Fed’s website.

2& His unproven theory was/is there is a direct correlation between the increase in M1 and tax receipts which  is as true,  inflation engages, prices of goods and services rise with it tax revenue.

Click here for the current Fed chart and all supporting historical data

Screenshot_869

28) What Ben didn’t take into account was the ability of U.S. politicians to outspend true inflation and tax receipt increases.

Click here for the current Fed chart and all supporting data

Screenshot_870

29) Nor did he take into account the the banking problems we’re slightly larger the TARP (700 billion) when CBS and Bloomberg were able to obtain the true figures through the Freedom of information act the total exceeded 7.7 trillion

30) Nor was his team prepared or honest

Rep. Alan Grayson questions the Fed inspector General where $9 trillion dollars went… the Fed inspector general elizabeth coleman didn’t have a clue or was it the 5th?

31) But being wrong and/or incompetent was nothing new to Ben Shalom Bernanke, B,S. Bernanke was consistently wrong on his calls on the economy before and after he became Fed chairman.

Click here for the video of his calls and the outcome

Screenshot_871

32) How U.S. “leaders” could let him orchestrate an unaudited, undisclosed mult-trillion dollar “economic stimulus” plan with his proven track record for failure is beyond me.

Economic stimulus did save the U.S. Treasury trillions in debt service costs at the expense of savers.

It did make banks trillions in inflated borrowing costs at the expense of borrowers.

It did increase the per capita portion of the national debt for every American taxpayer from 67K to over 130K.

33) Now without the Fed creating trillions of dollars with keypunch entries to buy the majority of US debt at non competitive prices who’s going to replace the Fed?

Click here for the current chart and all supporting historical data

Screenshot_872

34) If the Fed fires up the QE printing press again US creditability will deteriorate even further potentially leading to 6 trillion in foreign held US debt being sold off.

Click here for the current Fed chart and all supporting historical data

Screenshot_873

35) USD currency risk for these foreign investors is more in one day than annual yields

The dollar is near a 10 year high and the world is questioning if the USD truly is the least worst place to be?

Click here for the Fed chart and all supporting historical data

Screenshot_874

36) Would you buy a U.S. Treasury with current currency risk at the rates below?

Click here for current Bloomberg quotes

Screenshot_875

37) China’s currency is also on deck to be the world’s 5th world reserve currency and their numbers according to the Fed are far superior to the US’s

38) Click here for China versus the US using the Fed’s numbers

Screenshot_880

39) From historic lows near zero what is the only direction short term rates can have a major market move?

Click here for the current chart and all supporting historical data

Screenshot_876

40) Rates will rise from either economic recovery or deteriorating U.S creditability the only question that remains is when.

41) Fed chair Yellen has spelled out where the Fed expects rates and when on multiple occasions over the last year,

Call if you have questions, need additional information, or wold like to do a 15 minute online review where I’ll show you exactly what we’re trading and how using actual trades.

When our review is complete you’ll be able to experiment with any potential outcome for these trades or your own risk/reward criteria.

If you have any questions contact  us.

Regards,
Peter Knight Advisor

—————————————————————-

Privacy Notice

Disclosure


Where the Fed Sees Rates and When

Fed expectations for hikes through December 2020 (as of 13 June 2018)
Full Fed press conference video (52:19) & Opening Statement (PDF)
Next Fed Meeting 31 July – 1 August 2018

Educational Links US Rate Analysis Euro Rate Analysis

2) Fed’s expectations for the rate they set and contract valuations

0.12% contract value = $500.00 (November 2015)
1.97% contract value = $8,208.33 (13 June 2018)
2.40% December 2018 = $10,000.00
3.10% December 2019 = $12,916.67
3.40% December 2020 = $14,166.67
Each 0.01 = $41.67

3) Fed Funds 1954 – 2018 chart Data & Contract Valuation (excel)

Four trades capturing the move higher in rates contact me or others.

4) Trading Fed Funds Futures

4.1) ZQZ18 Quote
4.2) 2 Year chart (daily data)
4.3) Quotes all deliveries
4.4) About Fed Funds Futures
4.5) What the Fed Funds Rate is and How it’s set
4.6) Interest Rate Educational Videos and Links
4.7) Today’s probability for a rate hike at the next Fed meeting
4.8) US Economic Reality 2000-2018

5) Fed Funds Trade

Entry = 0.8350 value $3,479.17 to Fed Objective 3.40 value $14,166.65

5.1) Entry short ZQZ18 99.1650 (3 October 2016)
Rate the contract price represents 100.0000 – 99.1650 = 0.8350%
Contract value = 0.8350 X $4,166.67 = $3,479.17

5.2) At Fed’s Objective 100.0000 – 3.40 = 99.6000
Rate the contract price represents 100.0000 – 99.6000 = 3.4000%
Contract value = 3.4000 X $4,166.67 = $14,166.65
Gain if the Fed is correct = +$10,687.48
This position will need to be rolled December 2018

Current chart updated every 5 minutes, each 0.01 = $41.67

6) Trading 3 month deposits outside the Treasury System (eurodollars)

6.1) Quotes all deliveries
6.2) About Eurodollar Interest Rate Futures
6.3) Video the basics of trading Eurodollar interest rate spreads
6.4) Interest Rate Educational Videos and Links
6.5) Today’s probability for a rate hike at the next Fed meeting
6.6) US Economic Reality 2000-2018

7) Trading the rate hikes between September 2018 and December 2020

Entry = 0.39 value $3,900 to the Fed’s Objective 1.40 value $14,000

7.1) Entry the 29th of May 2018
Long 4 December 2018 GEU18 97.6350
Short 4 December 2020 GEZ20 – 97.2450
IntraMarket Spread GEZ18 97.6350 – GEZ20 97.2450 = 0.39
Market’s expected rate hike between Sep. 2018 & Dec. 2020 = 0.39%
Entry position value = 0.3900 X $10,000.00 = $3,900.00

7.2) Our Objective is the Fed’s Target
Fed’s expected rate hikes by December 2020 = 1.40
Position value at the Fed’s target, 1.40 X $10,000.00 = $14,000.00
(The nearby delivery will have to be “rolled” quarterly)
7 year spread chart GEU18 – GEZ20

Intraday GEU18 -GEZ20 chart updated every 5 minutes each 0.01 = $100.00

Strategy: I’m using split objectives on this trade, 1/2 of the position (2 contracts) in at 0.40 or better out at 0.55 to 0.75. 1/2 (2 contracts) trading long-term from 0.3150 to the objective of 1.40 or until we have to roll the GEU18 or the major trend reverses.

8) Trading Rate hikes between December 2018 and December 2020

8.1) Entry the 29th of May 2018
Long 4 December 2018 GEZ18 97.4200
Short 4 December 2020 GEZ20 – 97.1050
IntraMarket Spread GEZ18 97.42 – GEZ20 97.1050 = 0.3150
Market’s expected rate hike between Dec. 2018 & Dec. 2020 = 0.3150%”
Position value 0.3150 X $10,000.00 = $3,150.00
Spread chart GEZ18 – GEZ20 in at 0.3150 expecting the price to increase
Complete report on this trade

8.2) Minimum Objective 0.65
Position value at 0.3150 entry = $3,150.00
Position value at the minimum objective of 0.65 = $6,500
Gain = $3,350 (106.34%)
Spread chart GEZ18 – GEZ20

8.3) At the Fed’s 1.00 target
Position value at 0.3150 entry = $3,150.00
Position value at the Fed’s target of 1.00 = $10,000.00
Gain = $6,850.00 (217.45%)
Spread chart GEZ18 – GEZ20

Current chart updated every 5 minutes, each 0.01 = $100.00

Strategy: I’m using split objectives on this trade, 1/2 of the position (2 contracts) in at 0.40 or better out at 0.55 to 0.65. 1/2 (2 contracts) trading long-term from 0.3150 to the objective of 1.10 or until we have to roll the GEZ18 or the major trend reverses.

9) Trading Rate hikes between September 2018 and December 2023

9.1) Entry the 31th of May 2018
Long 4 September 2018 GEU18 97.5650
Short 4 December 2023 GEU23 – 96.9950
Intramarket Spread GEU18 (97.5650) – GEZ23 (96.9950) =0.5750%
Market’s expected rate hike between Sep. 2018 & Dec. 2023 = 0.5750%
Position value 0.5750 X $10,000.00 = $5,750.00
Spread chart GEZ18 – GEZ23 in at 0.5750 expecting the price to increase

9.2) Minimum Objective 1.00
Position value at 0.5750 entry =$5,750.00
Position value at the minimum objective of 1.00 = $10,000.00
Gain = $4,250.00 (73.91%)
Spread chart GEZ18 – GEZ23

9.3) Our Long Term Objective 2.10
Position value at 0.5750 entry = $5,750.00
Position value at the objective 2.10 = $21,000.00
Gain = $15,250.00 (265.21%)
Spread chart GEZ18 – GEZ23

Current chart updated every 30 minutes, each 0.01 = $100.00

Strategy: I’m using split objectives on this trade, 1/2 of the position (2 contracts) in at 0.60 or better out at 0.75 to 0.90. 1/2 (2 contracts) trading long-term from 0.5750 to the objective of 2.10 or until we have to roll the GEU18 or the major trend reverses.

10) If you’d like to track additional positions send me message

Other rates traded
10.1) US Rates Traded
10.2) European Rates Traded
10.3) Australian Interest rates Traded

11) Rate Reports

11.1) Trading 3 Month Rates Higher & Fed Expectations 24 September 2015
11.2) Countdown To Higher U.S. Interest Rates 9 October 2015
11.3) Market Versus Fed For Rates 16 September 2016
11.4) Trading Rates Higher & Fed Expectations 20 January 2017
11.5) Trading Rates Higher & Fed Expectations 13 March 2017
11.6) Trading Rates Higher & Fed Expectations 28 November 2017

12) Original Positions & Updates Published On Seeking Alpha & Here

12.1) Original positions published on Seeking Alpha 5 November 2015
12.2) Update on Seeking Alpha 5 September 2016
12.3) Update Seeking Alpha 13 January 2017
12.4) Trading Rates Higher Using Cost Averaging 24 March 2015
12.5) Trading 3 Month Rates Higher & Fed Expectations 27 April 2015
12.7) Trading Rates Higher & Fed Expectations 9 June 2015
12.8) The Math On Why U.S. Inflation Is “contained” 22 July 2015
12.9) Hedging Treasury Risk 3 August 2015
12.10) Trading the Fed Funds Rate Higher 23 July 2015
12.11) What I See On The Horizon 6 August 2015

13) Fed Funds Risk Reward Spreadsheets

13.1) What the Fed funds rate is and how it’s set
13.2)
3 Month Rates March, June December Fed Funds March hedge

13.3) Fed Funds December 2016
13.4) Fed Funds March 2016 S 99.74 (no hedge)
13.5) Fed Funds December 2016 S 99.46 (no hedge) 100K
13.6) Fed Funds December 2016 S 99.46 (no hedge) 10K
13.7) Trading 3 month rates higher through December 2016
13.8) July 2015 25k no hedge
13.9) July 2015 99.83 25K cost average hedge
13.10) July 2015 99.82 25K 87.50 hedge
13.11) July 2015 10K 99.81/99.75 hedge
13.12) Sep 2015 25k cost average hedge
13.13) Oct 2015 25K cost average hedge
13.14) Dec 2015 25K cost average hedge

14) 3 Month Deposit Spreadsheets

14.1) What the 3 month rate is and it’s history
14.2) 3 Month Dec 2017 S 99.70 (no hedge)

14.2) 3 Month put weighted vol spread Dec 2017
14.3) 3 Month vol spread Dec 2017
14.4) 3 Month vol bear spread no hedge Dec 2017
14.5) 3 Month GEH-M-Z-201616 Fed Funds ZQ-H16 10.05.2015
14.6) Contract specifications
14.7) 3 Month Hedged Cost Average
14.8) 3 Month Rate September 2015 hedge
14.9) 3 Month Rate December 2015 hedge

15) Other Interest markets we trade

15.1) All US interest rate markets we trade
15.2) European interest rates
15.3) Australian Interest rates
15.4) Educational videos and Links

Open An Account

If you’d like to review this trade, or any of the other programs in our line-up contact me.

Regards,
Peter Knight Advisor
Asset Investment Management

—————————————————————-

Privacy Notice

Disclosure


Revew links 8

x

Click here for contact details


——————————————————————————————————————-

RISK DISCLOSURE STATEMENTPROGRAM AVAILABILITY IS DEPENDENT ON YOUR COUNTRY OF RESIDENCY AND FINANCIAL STATUS

PAST RESULTS ARE NOT NECESSARILY INDICATIVE OF FUTURE RESULTS.

EXAMPLES OF HISTORIC PRICE MOVES OR EXTREME MARKET CONDITIONS ARE NOT MEANT TO IMPLY THAT SUCH MOVES OR CONDITIONS ARE COMMON OCCURRENCES OR ARE LIKELY TO OCCUR. HYPOTHETICAL PERFORMANCE RESULTS HAVE MANY INHERENT LIMITATIONS, SOME OF WHICH ARE DESCRIBED BELOW. NO REPRESENTATION IS BEING MADE THAT ANY ACCOUNT WILL OR IS LIKELY TO ACHIEVE PROFITS OR LOSSES SIMILAR TO THOSE SHOWN, THERE ARE FREQUENTLY SHARP DIFFERENCES BETWEEN HYPOTHETICAL PERFORMANCE RESULTS AND THE ACTUAL RESULTS SUBSEQUENTLY ACHIEVED BY ANY PARTICULAR TRADING PROGRAM. ONE OF THE LIMITATIONS OF HYPOTHETICAL PERFORMANCE RESULTS IS THAT THEY ARE GENERALLY PREPARED WITH THE BENEFIT OF HINDSIGHT. IN ADDITION, HYPOTHETICAL TRADING DOES NOT INVOLVE FINANCIAL RISK, AND NO HYPOTHETICAL TRADING RECORD CAN COMPLETELY ACCOUNT FOR THE IMPACT OF FINANCIAL RISK IN ACTUAL TRADING. FOR EXAMPLE, THE ABILITY TO WITHSTAND LOSSES OR TO ADHERE TO A PARTICULAR TRADING PROGRAM IN SPITE OF TRADING LOSSES WHICH CAN ALSO ADVERSELY AFFECT ACTUAL TRADING RESULTS.

THERE ARE NUMEROUS OTHER FACTORS RELATED TO THE MARKETS IN GENERAL OR TO THE IMPLEMENTATION OF ANY SPECIFIC TRADE PROGRAM WHICH CANNOT BE FULLY ACCOUNTED FOR IN THE PREPARATION OF HYPOTHETICAL PERFORMANCE RESULTS ALL OF WHICH CAN ADVERSELY AFFECT ACTUAL TRADING RESULTS.

BID/ASK SPREADS, BROKERAGE COMMISSION, CLEARING, EXCHANGE AND REGULATORY FEES WILL HAVE AN ADVERSE IMPACT ON THE NET OVERALL PERFORMANCE OF YOUR ACCOUNT. PRIOR TO MAKING A DECISION TO PARTICIPATE IN ANY INVESTMENT MAKE SURE YOU FULLY UNDERSTAND THE FEES ASSOCIATED WITH TRADING.

THE INFORMATION PROVIDED IN THIS REPORT CONTAINS RESEARCH, MARKET COMMENTARY AND TRADE RECOMMENDATIONS. YOU MAY BE SOLICITED FOR AN ACCOUNT BY ONE OF OUR REPRESENTATIVES OR EMPLOYEES. IT SHOULD BE KNOWN THAT THE REPRESENTATIVES OF ANY FIRM MAY TRADE FUTURES AND OPTIONS FOR THEIR OWN ACCOUNTS OR THOSE OF OTHERS. DUE TO VARIOUS FACTORS (SUCH AS MARGIN REQUIREMENTS, RISK FACTORS, TRADING OBJECTIVES, TRADING INSTRUCTIONS, TRADING STRATEGIES, AND OTHER FACTORS) SUCH TRADING MAY RESULT IN THE LIQUIDATION OR INITIATION OF FUTURES OR OPTIONS POSITIONS MAY DIFFER FROM THE OPINIONS AND RECOMMENDATIONS FOUND IN THIS REPORT.

PAST PERFORMANCE IS NOT NECESSARILY INDICATIVE OF FUTURE PERFORMANCE. THE RISK OF LOSS IN DERIVATIVE CONTRACTS CAN BE SUBSTANTIAL THEREFORE INVESTORS SHOULD UNDERSTAND THE RISKS INVOLVED IN TAKING ANY LEVERAGED POSITION AND MUST BE IN A POSITION ASSUME LOSS FOR THE RISKS ASSOCIATED WITH SUCH INVESTMENTS AND FOR TRADE RESULTS.

PLEASE CAREFULLY CONSIDER WHETHER SUCH TRADING IS SUITABLE FOR YOU IN LIGHT OF YOUR CIRCUMSTANCES AND RESOURCES.