
Bank Name BMO Harris Bank NA
Bank Address 111 West Monroe St, Chicago, IL 60690
ABA 071000288
Swift Code HATRUS44
Account Name Tradeview Ltd
Account Number 4246757
Ultimate credit
ACCOUNT ADDRESS:
103 S Church St, 4th Floor, GC, CI, KY1-1002
If you have any questions or would like to do an online review contact me.
Peter Knight Advisor
Direct VI Phone 24/7 +340 244 4310
Skype: Peter-Knight-Advisor
Message me
Schedule an online review
Peter_Knight@peterknightadvisor.com
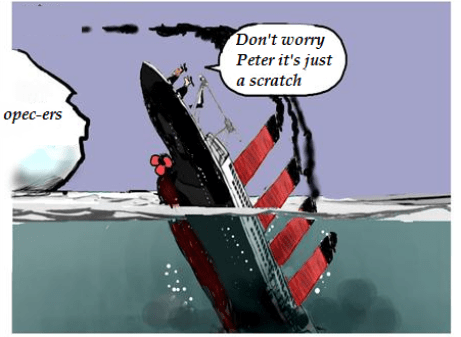
Now that oil and gasoline cost less than bottled water maybe it’s time to start looking at covering our short positions. Don’t get me wrong I’m not ready to use the L word just yet ( long ) but I can clearly see long positions on the horizon at lower levels.
The downward spiral is still intact but history has proved short selling parties can’t last forever.

Just how inexpensive is crude oil?
Let’s look at the 30 year chart for a barrel of crude priced in gold
All time high 0.15050 of an ounce June 2008
All time low 0.03322 of an ounce July 1986
Current 0.03370 of an ounce December 2015
1986-2015 average 0.69889
Distance from the all time low priced in gold 0.00048 of an ounce or about 50 cents.
Click on any image to enlarge it

Source & supporting data Federal Reserve data 1986-2105-cost-of-oil-priced-in-gold
1986 – 2015 oil gold ratio, (oil normally trades above gold on this ratio)

Source Federal Reserve
Historically
Is $34.52 per barrel misleading if you look at the historical price action from 1993-2015 calculated in inflation adjusted dollars?
All time high $147.27 per barrel July 2008 ($162.34 in 2015 USD)
All time low $10.35 per barrel December 1998 ($15.80 in 2015 USD)
The 30 year average price for oil is $42.87 ($59.09 in 2015 USD)
2015 dollars generated using the BLS.GOV Inflation Calculator
Current cash oil price $34.52 per barrel
 Data source Chicago Mercantile Exchange
The Fundamentals are still weak
The technical’s are still weak
Daily = downtrend

Weekly = downtrend

Monthly = downtrend

The spread between a gallon WTI crude and wholesale gasoline is more than twice the historical average.
1990-2015 historical average, $0.2147 ($0.28 in 2015 dollars)
Current 12 month rolling average = $0.4426

Spread between WTI crude and retail gasoline, better than average
1990-2015 historical average is $0.8642 ($1.14 in 2015 USD)
Current 12 month rolling average = $1.2612

Spread between wholesale and retail gasoline, consistent with the historical average.
1990-2015 historical average is $0.6496 ($0.86 in 2015 USD)
Current 12 month rolling average = $0.8186

Where the Futures market is pricing Crude Oil through December 2024

Ratios tell me to maintain shorts, technicals say stay short, futures markets indicate higher prices.
One current crude oil position to track
Short March 2016 deliver at $46.80, contract value $46,800
Deposit posted per contract = $15,000
Exchange margin per contract = $3,800
March 2016 is currently trading at $36.74, contract value $36,740

I’d like to cover these $46.80 shorts, reverse to long at $33.00.
1) to cover my $46.80 shorts I’m going to write a put at the $33.00 strike collecting $1.24 per barrel or $1,240 per contract (expires in 58 days). The only way my current $46.80 short can be “pulled” away is if the market falls from the current price of $36.74 down to $33.00. Should this occur my short position would appreciate by another $3,740 per contract between now and 17 February 2016 expiration. If March delivery never goes down to $33.00 I keep the $1,240 put premium collected against my $46.80 short.
2) I’m also going the write another put at $33.00 collecting another $1,240, again if March 2016 WTI crude does not trade down to $33.00 I keep the $1,240 in time premium. If it does go below $33.00 I was paid $1,240 to enter a new long position at $33.00 or $3,740 per contract better than where the market is currently trading ($36.74), (yes I’ll have to offset and roll the position in March)
3) If the market stays the same I’ve collected $2,480 over the next 58 days on a position if delivered is worth $33,000.
4) If oil starts to rally I can cover my $46.80 shorts and watch the $33.00 puts expire worthless (+$2,480). There are several other ways to offset my $46.80 shorts, example, writing an in the money put at $40.00 currently trading at $4.59 collecting $4,590 in premium ($920 in time value)
On the upside the current position is trading at $36.74 contract value $36,740 (1000 barrel contract X $36.74 per barrel) or I’m getting paid 6.750% in total time value over the next 58 days to liquidate my $46.80 if the market goes down to $33.00
If $33.00 is put is hit my gain on the trade = $13,800 per contract plus the collected time value of $2,480 for a total of $16,200.
The margin I’m allocating on this position is $15,000 per contract. (Exchange margin = $3,800 per contract)

What this strategy has done is paid me 16.53% in option time value on my $15,000 deposit per contract to be patient over the next 58 days.
Many traders don’t realize how collecting fat time premium can work for you.
Let’s assume the market is right and crude oil bottoms at the current price of $36.74 (March 2016 delivery)
Let’s assume you go long crude oil at $36.74
Wrote an out of the money call at $39.50
$39.50 call is trading at $1.59
You’re collecting $1.59 per barrel, $1,590 per contract, $27.41 per day or $10,006 per year on a position that has a total value of $36,740.
The time value writing out of the money options = 27.23% in annual time premium collected or 66.70% on the $15,000 allocated to cover the $3,800 in exchange margin.
We’re posting $11,200 more than is required by the exchange to minimize the probability of a call. Our margin for error without being in jeopardy of having a call is $11.20 a barrel plus whatever option premium collected, in this case $1.59 for a total of $12.79.
In order for us to be on call (in this example) March 2016 crude oil would need to fall below $23.95 a barrel between now and 17 February 2016 (58 days). Again I’m not advocating getting in at $36.74, I’m using this as an example to show you how hefty the time premium is writing out of the money calls to generate income against a long crude oil position.
In this example the only way your $36.80 position can be called away from us is at $39.50 for a $2.70 profit per barrel or $2,700 per contract. If it does not get called away we’d keep the time premium against our long of $1,590 (+10.60% on the $15,000 deposit for 58 days).

In my case I’m writing the $33.00 put to get into a $33.00 long position collecting $1,240 in time value, if delivered at $33.00 I’ll write the $36.00 or $37.00 call against the delivered $33.00 long collecting anther $1,000 to $2,500 against the $33.00 long. (I will have to roll this position to forward delivery month)
Energy Stocks
Energy stocks might not be a sick as all the academic chatter generated by the tradeless master debaters. Sure crude may go down to $20 maybe $10 who cares? There are defined risk strategies to capture the move in both crude and energy stocks if you’re up to speed and can handle the risk.
Fact over the next 5 years the world will need energy and the additional products crude produces. Demand may go down but population will increase and there are scores of situations that could generate a nice rally in crude from the low 30’s as well as energy stocks.
Many of these energy stocks you can trade using same strategy of writing puts to get in and calls to get out as I’ve explained in the crude oil example above. Word of caution you have to watch your bid/ask spreads, make sure you get firm quotes on the bid/ask, match them up to your other desks and always use price orders.
On the horizon I see short covering and potential net new long positions entering in energy stocks. Yes, the charts still look ugly, if you want to be less aggressive wait for the turn (change in trend) using something as simple as a Bollinger 20,2 and exponential moving average 9 on weekly data in the examples below.
Exxon Mobil Corporation (XOM)

BP P.L.C. (BP)

Royal Dutch Shell plc (RDS.A)

Chevron Corporation (CVX)

Valero Energy Corporation (VLO) (no short on this)

Petrobras – Petroleo Brasileiro S.A. (PBR)

Marathon Petroleum Corp. (MPC) (no short this)

ConocoPhillips (COP)

Suncor Energy Inc. (SU)

TOTAL S.A. (TOT)

Statoil ASA (STO)

Yes, oil is inexpensive and appears to be moving lower but the world still needs it. We will eventually find a bottom, might as well get paid on our short positions while we wait.

If you have questions or would like additional information contact me.
——————————————————————————————————————-
RISK DISCLOSURE STATEMENT PAST RESULTS ARE NOT NECESSARILY INDICATIVE OF FUTURE RESULTS.
UNTIL REGULATORY REFORM IS ESTABLISHED IN THE U.S. WE ARE NOT ACCEPTING U.S. ACCOUNTS.
EXAMPLES OF HISTORIC PRICE MOVES OR EXTREME MARKET CONDITIONS ARE NOT MEANT TO IMPLY THAT SUCH MOVES OR CONDITIONS ARE COMMON OCCURRENCES OR ARE LIKELY TO OCCUR. HYPOTHETICAL PERFORMANCE RESULTS HAVE MANY INHERENT LIMITATIONS, SOME OF WHICH ARE DESCRIBED BELOW. NO REPRESENTATION IS BEING MADE THAT ANY ACCOUNT WILL OR IS LIKELY TO ACHIEVE PROFITS OR LOSSES SIMILAR TO THOSE SHOWN, THERE ARE FREQUENTLY SHARP DIFFERENCES BETWEEN HYPOTHETICAL PERFORMANCE RESULTS AND THE ACTUAL RESULTS SUBSEQUENTLY ACHIEVED BY ANY PARTICULAR TRADING PROGRAM. ONE OF THE LIMITATIONS OF HYPOTHETICAL PERFORMANCE RESULTS IS THAT THEY ARE GENERALLY PREPARED WITH THE BENEFIT OF HINDSIGHT. IN ADDITION, HYPOTHETICAL TRADING DOES NOT INVOLVE FINANCIAL RISK, AND NO HYPOTHETICAL TRADING RECORD CAN COMPLETELY ACCOUNT FOR THE IMPACT OF FINANCIAL RISK IN ACTUAL TRADING. FOR EXAMPLE, THE ABILITY TO WITHSTAND LOSSES OR TO ADHERE TO A PARTICULAR TRADING PROGRAM IN SPITE OF TRADING LOSSES WHICH CAN ALSO ADVERSELY AFFECT ACTUAL TRADING RESULTS.
THERE ARE NUMEROUS OTHER FACTORS RELATED TO THE MARKETS IN GENERAL OR TO THE IMPLEMENTATION OF ANY SPECIFIC TRADE PROGRAM WHICH CANNOT BE FULLY ACCOUNTED FOR IN THE PREPARATION OF HYPOTHETICAL PERFORMANCE RESULTS ALL OF WHICH CAN ADVERSELY AFFECT ACTUAL TRADING RESULTS.
BID/ASK SPREADS, BROKERAGE COMMISSION, CLEARING, EXCHANGE AND REGULATORY FEES WILL HAVE AN ADVERSE IMPACT ON THE NET OVERALL PERFORMANCE OF YOUR ACCOUNT. PRIOR TO MAKING A DECISION TO PARTICIPATE IN ANY INVESTMENT MAKE SURE YOU FULLY UNDERSTAND THE FEES ASSOCIATED WITH TRADING.
THE INFORMATION PROVIDED IN THIS REPORT CONTAINS RESEARCH, MARKET COMMENTARY AND TRADE RECOMMENDATIONS. YOU MAY BE SOLICITED FOR AN ACCOUNT BY ONE OF OUR REPRESENTATIVES OR EMPLOYEES. IT SHOULD BE KNOWN THAT THE REPRESENTATIVES OF ANY FIRM MAY TRADE FUTURES AND OPTIONS FOR THEIR OWN ACCOUNTS OR THOSE OF OTHERS. DUE TO VARIOUS FACTORS (SUCH AS MARGIN REQUIREMENTS, RISK FACTORS, TRADING OBJECTIVES, TRADING INSTRUCTIONS, TRADING STRATEGIES, AND OTHER FACTORS) SUCH TRADING MAY RESULT IN THE LIQUIDATION OR INITIATION OF FUTURES OR OPTIONS POSITIONS MAY DIFFER FROM THE OPINIONS AND RECOMMENDATIONS FOUND IN THIS REPORT.
PAST PERFORMANCE IS NOT NECESSARILY INDICATIVE OF FUTURE PERFORMANCE. THE RISK OF LOSS IN DERIVATIVE CONTRACTS CAN BE SUBSTANTIAL THEREFORE INVESTORS SHOULD UNDERSTAND THE RISKS INVOLVED IN TAKING ANY LEVERAGED POSITION AND MUST BE IN A POSITION ASSUME LOSS FOR THE RISKS ASSOCIATED WITH SUCH INVESTMENTS AND FOR TRADE RESULTS.
PLEASE CAREFULLY CONSIDER WHETHER SUCH TRADING IS SUITABLE FOR YOU IN LIGHT OF YOUR CIRCUMSTANCES AND RESOURCES.
Highlights
If you have any questions call or email
Regards,
Peter Knight
RISK DISCLOSURE STATEMENT
PROGRAM AVAILABILITY IS DEPENDENT ON YOUR COUNTRY OF RESIDENCY AND FINANCIAL STATUS
PAST RESULTS ARE NOT NECESSARILY INDICATIVE OF FUTURE RESULTS. EXAMPLES OF HISTORIC PRICE MOVES OR EXTREME MARKET CONDITIONS ARE NOT MEANT TO IMPLY THAT SUCH MOVES OR CONDITIONS ARE COMMON OCCURRENCES OR ARE LIKELY TO OCCUR.
HYPOTHETICAL PERFORMANCE RESULTS HAVE MANY INHERENT LIMITATIONS, SOME OF WHICH ARE DESCRIBED BELOW. NO REPRESENTATION IS BEING MADE THAT ANY ACCOUNT WILL OR IS LIKELY TO ACHIEVE PROFITS OR LOSSES SIMILAR TO THOSE SHOWN IN FACT, THERE ARE FREQUENTLY SHARP DIFFERENCES BETWEEN HYPOTHETICAL PERFORMANCE RESULTS AND THE ACTUAL RESULTS SUBSEQUENTLY ACHIEVED BY ANY PARTICULAR TRADING PROGRAM. ONE OF THE LIMITATIONS OF HYPOTHETICAL PERFORMANCE RESULTS IS THAT THEY ARE GENERALLY PREPARED WITH THE BENEFIT OF HINDSIGHT.
IN ADDITION, HYPOTHETICAL TRADING DOES NOT INVOLVE FINANCIAL RISK, AND NO HYPOTHETICAL TRADING RECORD CAN COMPLETELY ACCOUNT FOR THE IMPACT OF FINANCIAL RISK IN ACTUAL TRADING. FOR EXAMPLE, THE ABILITY TO WITHSTAND LOSSES OR TO ADHERE TO A PARTICULAR TRADING PROGRAM IN SPITE OF TRADING LOSSES ARE MATERIAL POINTS WHICH CAN ALSO ADVERSELY AFFECT ACTUAL TRADING RESULTS. THERE ARE NUMEROUS OTHER FACTORS RELATED TO THE MARKETS IN GENERAL OR TO THE IMPLEMENTATION OF ANY SPECIFIC TRADE PROGRAM WHICH CANNOT BE FULLY ACCOUNTED FOR IN THE PREPARATION OF THE HYPOTHETICAL PERFORMANCE RESULTS AND ALL OF WHICH CAN ADVERSELY AFFECT ACTUAL TRADING RESULTS.
BID/ASK SPREADS, BROKERAGE COMMISSION, CLEARING, EXCHANGE AND REGULATORY FEES WILL HAVE AN ADVERSE IMPACT ON THE NET OVERALL PERFORMANCE OF YOUR ACCOUNT. PRIOR TO MAKING A DECISION TO PARTICIPATE IN ANY INVESTMENT MAKE SURE YOU FULLY UNDERSTAND THE FEES ASSOCIATED WITH TRADING.
THE INFORMATION PROVIDED IN THIS REPORT CONTAINS RESEARCH, MARKET COMMENTARY AND TRADE RECOMMENDATIONS. YOU MAY BE SOLICITED FOR AN ACCOUNT BY ONE OF OUR REPRESENTATIVES OR EMPLOYEES. IT SHOULD BE KNOWN THAT THE REPRESENTATIVES OF OUR FIRM MAY TRADE FUTURES AND OPTIONS FOR THEIR OWN ACCOUNTS OR THOSE OF OTHERS. DUE TO VARIOUS FACTORS (SUCH AS MARGIN REQUIREMENTS, RISK FACTORS, TRADING OBJECTIVES, TRADING INSTRUCTIONS, TRADING STRATEGIES, AND OTHER FACTORS) SUCH TRADING MAY RESULT IN THE LIQUIDATION OR INITIATION OF FUTURES OR OPTIONS POSITIONS THAT DIFFER FROM THE OPINIONS AND RECOMMENDATIONS FOUND IN THIS REPORT.
PAST PERFORMANCE IS NOT NECESSARILY INDICATIVE OF FUTURE PERFORMANCE. THE RISK OF LOSS IN TRADING FUTURES CONTRACTS OR COMMODITY OPTIONS CAN BE SUBSTANTIAL, AND THEREFORE INVESTORS SHOULD UNDERSTAND THE RISKS INVOLVED IN TAKING LEVERAGED POSITIONS AND MUST ASSUME RESPONSIBILITY FOR THE RISKS ASSOCIATED WITH SUCH INVESTMENTS AND FOR THEIR RESULTS.
The Chinese Yuan, also known as the Renminbi, has joined the IMF’s reserve-currency basket. This will add value to the currency but also brings obligations for Beijing.

It’s been a done deal since the beginning of the week. The executive board of the International Monetary Fund (IMF) has decided to add the yuan in its currency basket. IMF Managing Director Christine Lagarde spoke of an “important milestone in the integration of the Chinese economy into the global financial system.” The Chinese currency becomes the fifth in the basket, alongside US dollar, the euro, the Japanese yen and British pound.
Decision made despite many critics
It was foreseeable that the IMF would make this decision, which nevertheless only comes into effect in October 2016. Beijing cannot rest on its laurels til then. It has to make progress on the financial reforms in China. It has done its homework, albeit much more slowly than had been hoped by the supporters of the yuan becoming a reserve currency. This is one reason why the list of skeptics is long. In the summer, when China’s stock markets went on a downward roller coaster ride, the signs that the yuan would meet the IMF’s strict criteria were still rather poor.
The main objection then (as now) was that unlike other reserve currencies, the yuan is not freely traded on the world markets. Beijing decides on the rate of fluctuation and its critics say that this is kept high through artificial means. But in the summer, the Chinese central bank devalued the yuan within a few days by more than 3 percent compared to the US dollar. Moreover, for over a year, China’s central bank has allowed the course to fluctuate up to 2 percent a day compared to the US dollar. The official justification for the measures is that Beijing wants to give the market greater leeway to balance the exchange rate. The five-year plan to be adopted in spring 2016 might perhaps allow the yuan to be traded completely freely.
More and more yuan-based business
The proportion of the yuan in global monetary transactions used to only amount to 2.8 percent, compared to 45 percent for the US dollar. The Chinese currency is catching up. For the past six years, Beijing has been trying to sign currency swap agreements with as many countries as possible. There are currently 40 such deals allowing countries to conduct their business in yuan rather than dollars. The yuan is also becoming increasingly visible on the world’s stock exchanges. In London, Zurich and Frankfurt, there are yuan clearing hubs that help make the Chinese currency more easily convertible. Two weeks ago, a new Sino-German exchange was launched in Frankfurt. Investors can trade about 200 yuan products at the CEINEX.
Now that the yuan has been admitted into the IMF currency basket, the era of the US dollar’s exclusivity is coming to an end. About a trillion yuan (147 billion euros) could end up on the bond market as soon as the yuan is activated in the IMF’s currency basket. The demand for the yuan could then rise to over 560 billion euros – although still only a fraction of the approximately 100 trillion dollar bond market worldwide. But, from Beijing’s viewpoint, it has won a round and secured glory for its historic advance into the international world of currencies and exchanges.
The US versus China using the Fed’s numbers
How China’s race to reserve currency status will rock markets
The Chinese currency is on track to become more important globally
Good Trading,
Peter Knight
Click here for contact details
x
RISK DISCLOSURE STATEMENT
PROGRAM AVAILABILITY IS DEPENDENT ON YOUR COUNTRY OF RESIDENCY AND FINANCIAL STATUS
PAST RESULTS ARE NOT NECESSARILY INDICATIVE OF FUTURE RESULTS. EXAMPLES OF HISTORIC PRICE MOVES OR EXTREME MARKET CONDITIONS ARE NOT MEANT TO IMPLY THAT SUCH MOVES OR CONDITIONS ARE COMMON OCCURRENCES OR ARE LIKELY TO OCCUR.
HYPOTHETICAL PERFORMANCE RESULTS HAVE MANY INHERENT LIMITATIONS, SOME OF WHICH ARE DESCRIBED BELOW. NO REPRESENTATION IS BEING MADE THAT ANY ACCOUNT WILL OR IS LIKELY TO ACHIEVE PROFITS OR LOSSES SIMILAR TO THOSE SHOWN IN FACT, THERE ARE FREQUENTLY SHARP DIFFERENCES BETWEEN HYPOTHETICAL PERFORMANCE RESULTS AND THE ACTUAL RESULTS SUBSEQUENTLY ACHIEVED BY ANY PARTICULAR TRADING PROGRAM. ONE OF THE LIMITATIONS OF HYPOTHETICAL PERFORMANCE RESULTS IS THAT THEY ARE GENERALLY PREPARED WITH THE BENEFIT OF HINDSIGHT.
IN ADDITION, HYPOTHETICAL TRADING DOES NOT INVOLVE FINANCIAL RISK, AND NO HYPOTHETICAL TRADING RECORD CAN COMPLETELY ACCOUNT FOR THE IMPACT OF FINANCIAL RISK IN ACTUAL TRADING. FOR EXAMPLE, THE ABILITY TO WITHSTAND LOSSES OR TO ADHERE TO A PARTICULAR TRADING PROGRAM IN SPITE OF TRADING LOSSES ARE MATERIAL POINTS WHICH CAN ALSO ADVERSELY AFFECT ACTUAL TRADING RESULTS. THERE ARE NUMEROUS OTHER FACTORS RELATED TO THE MARKETS IN GENERAL OR TO THE IMPLEMENTATION OF ANY SPECIFIC TRADE PROGRAM WHICH CANNOT BE FULLY ACCOUNTED FOR IN THE PREPARATION OF THE HYPOTHETICAL PERFORMANCE RESULTS AND ALL OF WHICH CAN ADVERSELY AFFECT ACTUAL TRADING RESULTS.
BID/ASK SPREADS, BROKERAGE COMMISSION, CLEARING, EXCHANGE AND REGULATORY FEES WILL HAVE AN ADVERSE IMPACT ON THE NET OVERALL PERFORMANCE OF YOUR ACCOUNT. PRIOR TO MAKING A DECISION TO PARTICIPATE IN ANY INVESTMENT MAKE SURE YOU FULLY UNDERSTAND THE FEES ASSOCIATED WITH TRADING.
THE INFORMATION PROVIDED IN THIS REPORT CONTAINS RESEARCH, MARKET COMMENTARY AND TRADE RECOMMENDATIONS. YOU MAY BE SOLICITED FOR AN ACCOUNT BY ONE OF OUR REPRESENTATIVES OR EMPLOYEES. IT SHOULD BE KNOWN THAT THE REPRESENTATIVES OF OUR FIRM MAY TRADE FUTURES AND OPTIONS FOR THEIR OWN ACCOUNTS OR THOSE OF OTHERS. DUE TO VARIOUS FACTORS (SUCH AS MARGIN REQUIREMENTS, RISK FACTORS, TRADING OBJECTIVES, TRADING INSTRUCTIONS, TRADING STRATEGIES, AND OTHER FACTORS) SUCH TRADING MAY RESULT IN THE LIQUIDATION OR INITIATION OF FUTURES OR OPTIONS POSITIONS THAT DIFFER FROM THE OPINIONS AND RECOMMENDATIONS FOUND IN THIS REPORT.
PAST PERFORMANCE IS NOT NECESSARILY INDICATIVE OF FUTURE PERFORMANCE. THE RISK OF LOSS IN TRADING FUTURES CONTRACTS OR COMMODITY OPTIONS CAN BE SUBSTANTIAL, AND THEREFORE INVESTORS SHOULD UNDERSTAND THE RISKS INVOLVED IN TAKING LEVERAGED POSITIONS AND MUST ASSUME RESPONSIBILITY FOR THE RISKS ASSOCIATED WITH SUCH INVESTMENTS AND FOR THEIR RESULTS.
YOU SHOULD CAREFULLY CONSIDER WHETHER SUCH TRADING IS SUITABLE FOR YOU IN LIGHT OF YOUR CIRCUMSTANCES AND FINANCIAL RESOURCES.
The Fed’s economic numbers for the US are the worst in US history. They certainly do not support the representation that the US economy is in recovery. What they show me is that “Economic stimulus” for the US taxpayer and economy has been the most costly economic policy failure in US history. For the supporting Federal Reserve data and charts see The harsh reality of “economic stimulus” using Fed data & charts
The very big hole in the theory that rates can’t rise is there is no one to replace the Federal Reserve and buy 30-100 billion per month of US Treasuries at non competitive rates to fund US deficit spending.
Click here for the current Fed chart and all supporting historical data

Here’s how I believe it’s going to go down
Over the last 7 years of “emergency and temporary rate cuts” the Fed has enabled the US Treasury to suck desperate depositors looking for any interest income at all into the long end of the curve. Currently the average duration for US debt is a little over 10 years with an average yield of 2.37% or the debt service cost for the US on the current 18.1 trillion in debt is fixed at 430 billion per year through 2026, source Treasury direct
Click here for current debt service cost

Had the US Treasury not refinanced their debt and fixed it for 10+ years at 2.37% each 1.00% increase in rates would consume 10% of total tax receipts (181 billion per 1.00%). Considering the US national debt during “economic stimulus” has risen 93% while tax receipts were up only 28%, this would be more than problematic for the US Treasury,
Click here for a current Fed chart and all supporting historical data

Now that the current 18.1 trillion in debt has been locked in at 2.37% through 2026 the Fed can raise rates without the US Treasury worrying about their debt service cost rising and consuming the majority of tax receipts if rates “normalize”.
The Fed can start slowly raising rates going into the US November 2016 election in the name of “economic recovery”
All debt instruments, stocks with high debt loads, precious metals and energy will feel the pressure and potentially move lower in the short term.
What will accelerate the move lower prior to recovery and new highs
Currently there is 6 trillion of US Treasury debt owned by non US Investors. Currency and instrument risk for these Non US investors is more in one day than annual yields. Non US investors also hold trillions more in non US Treasury debt with these instruments having the same or greater risk.
For Non US investors there is very limited upside potential with debt instrument prices coming off all time highs and the dollar a 10 year high.
Click here for the chart and all supporting historical data

No alternative to the USD? Think again, there are currently 12 countries that have higher credit ratings than the US the majority of these countries have the same or higher rates with greater currency appreciation potential.
Click here for the supporting data

As the major long term trends for these instruments and the USD move from up to down I believe non US investors will start aggressively selling these instruments and USD accelerating the downward move caused by the increase in rates.
Currently I can’t see anyone capable of stepping in front of this multi trillion dollar selloff aside from the Fed. For non investors like me we’ll not only liquidate our longs but create net new shorts to capture the move lower. No liquidity for us? Think again the US 3 month rate contract traded at the Chicago Mercantile by itself trades a face value of trades over 2 trillion dollars per day, open interest for futures and options exceeds 20 trillion, there are an additional 40 interest rate futures contracts that trade trillions more
Trillions more traded daily in the forex market making the exodus from the USD painless.
In the short term the move to the downside could get ugly this is why I’ve recommend using “collars” to define risk on all trades and for the duration of all trading periods.
If the “correction” that I’m anticipating occurs the Fed will have the justification I believe they are looking for to fire up the QE printing press with tenacity creating trillions more USD with keypunch entries backed by no tangible assets or income flow to “defend” the dollar and protect the “integrity” of the US financial system.
With trillions more dollars chasing after the same amount of goods and services US inflation will engage.
When the prices of goods and services rise so do tax receipts. The chart below shows the 50 year correlation between M1 (money supply) and tax receipts
Click here for the current Fed chart and all supporting historical data

Let’s assume between now and the end of 2020 the Fed increases M1 by several trillion more through “quantitative easing” cutting the buying power of the USD in half, the prices of goods and services could double and tax receipts will double as well moving from the current 1.8 trillion to 3.6 trillion.
Problem solved
Debt service cost has been fixed at 2.37% through 2026 at 430 billion annually.
The US treasury through inflation has increased tax receipts from 1.8 trillion to 3.6 trillion giving the US Treasury twice the tax receipts to service the same 430 billion in annual fixed debt service cost on the current 18.1 trillion in debt.
I believe the Fed’s plan is the only out for the US, if the US can control it’s spending and keep deficits contained moving forward it just work.
It’s called monetization and it’s been around since the first “fiat” currency was introduced by China in 1,000 AD.
21 November 2002 speech “Deflation: Making Sure It Doesn’t Happen Here” will provide you more information on monetization.
Bernanke quote in this speech
“U.S. dollars have value only to the extent that they are strictly limited in supply. But the U.S. government has a technology, called a printing press (or, today, its electronic equivalent), that allows it to produce as many U.S. dollars as it wishes at essentially no cost. By increasing the number of U.S. dollars in circulation, or even by credibly threatening to do so, the U.S. government can also reduce the value of a dollar in terms of goods and services, which is equivalent to raising the prices in dollars of those goods and services. We conclude that, under a paper-money system, a determined government can always generate higher spending and hence positive inflation”.
During “economic stimulus” the Federal Reserve has created 4.216 trillion USD backed by no tangible asset or income flow, source the Federal Reserve
Good Trading,
Peter Knight
Click here for contact details
x
RISK DISCLOSURE STATEMENT
PROGRAM AVAILABILITY IS DEPENDENT ON YOUR COUNTRY OF RESIDENCY AND FINANCIAL STATUS
PAST RESULTS ARE NOT NECESSARILY INDICATIVE OF FUTURE RESULTS. EXAMPLES OF HISTORIC PRICE MOVES OR EXTREME MARKET CONDITIONS ARE NOT MEANT TO IMPLY THAT SUCH MOVES OR CONDITIONS ARE COMMON OCCURRENCES OR ARE LIKELY TO OCCUR.
HYPOTHETICAL PERFORMANCE RESULTS HAVE MANY INHERENT LIMITATIONS, SOME OF WHICH ARE DESCRIBED BELOW. NO REPRESENTATION IS BEING MADE THAT ANY ACCOUNT WILL OR IS LIKELY TO ACHIEVE PROFITS OR LOSSES SIMILAR TO THOSE SHOWN IN FACT, THERE ARE FREQUENTLY SHARP DIFFERENCES BETWEEN HYPOTHETICAL PERFORMANCE RESULTS AND THE ACTUAL RESULTS SUBSEQUENTLY ACHIEVED BY ANY PARTICULAR TRADING PROGRAM. ONE OF THE LIMITATIONS OF HYPOTHETICAL PERFORMANCE RESULTS IS THAT THEY ARE GENERALLY PREPARED WITH THE BENEFIT OF HINDSIGHT.
IN ADDITION, HYPOTHETICAL TRADING DOES NOT INVOLVE FINANCIAL RISK, AND NO HYPOTHETICAL TRADING RECORD CAN COMPLETELY ACCOUNT FOR THE IMPACT OF FINANCIAL RISK IN ACTUAL TRADING. FOR EXAMPLE, THE ABILITY TO WITHSTAND LOSSES OR TO ADHERE TO A PARTICULAR TRADING PROGRAM IN SPITE OF TRADING LOSSES ARE MATERIAL POINTS WHICH CAN ALSO ADVERSELY AFFECT ACTUAL TRADING RESULTS. THERE ARE NUMEROUS OTHER FACTORS RELATED TO THE MARKETS IN GENERAL OR TO THE IMPLEMENTATION OF ANY SPECIFIC TRADE PROGRAM WHICH CANNOT BE FULLY ACCOUNTED FOR IN THE PREPARATION OF THE HYPOTHETICAL PERFORMANCE RESULTS AND ALL OF WHICH CAN ADVERSELY AFFECT ACTUAL TRADING RESULTS.
BID/ASK SPREADS, BROKERAGE COMMISSION, CLEARING, EXCHANGE AND REGULATORY FEES WILL HAVE AN ADVERSE IMPACT ON THE NET OVERALL PERFORMANCE OF YOUR ACCOUNT. PRIOR TO MAKING A DECISION TO PARTICIPATE IN ANY INVESTMENT MAKE SURE YOU FULLY UNDERSTAND THE FEES ASSOCIATED WITH TRADING.
THE INFORMATION PROVIDED IN THIS REPORT CONTAINS RESEARCH, MARKET COMMENTARY AND TRADE RECOMMENDATIONS. YOU MAY BE SOLICITED FOR AN ACCOUNT BY ONE OF OUR REPRESENTATIVES OR EMPLOYEES. IT SHOULD BE KNOWN THAT THE REPRESENTATIVES OF OUR FIRM MAY TRADE FUTURES AND OPTIONS FOR THEIR OWN ACCOUNTS OR THOSE OF OTHERS. DUE TO VARIOUS FACTORS (SUCH AS MARGIN REQUIREMENTS, RISK FACTORS, TRADING OBJECTIVES, TRADING INSTRUCTIONS, TRADING STRATEGIES, AND OTHER FACTORS) SUCH TRADING MAY RESULT IN THE LIQUIDATION OR INITIATION OF FUTURES OR OPTIONS POSITIONS THAT DIFFER FROM THE OPINIONS AND RECOMMENDATIONS FOUND IN THIS REPORT.
PAST PERFORMANCE IS NOT NECESSARILY INDICATIVE OF FUTURE PERFORMANCE. THE RISK OF LOSS IN TRADING FUTURES CONTRACTS OR COMMODITY OPTIONS CAN BE SUBSTANTIAL, AND THEREFORE INVESTORS SHOULD UNDERSTAND THE RISKS INVOLVED IN TAKING LEVERAGED POSITIONS AND MUST ASSUME RESPONSIBILITY FOR THE RISKS ASSOCIATED WITH SUCH INVESTMENTS AND FOR THEIR RESULTS.
YOU SHOULD CAREFULLY CONSIDER WHETHER SUCH TRADING IS SUITABLE FOR YOU IN LIGHT OF YOUR CIRCUMSTANCES AND FINANCIAL RESOURCES.
1) Fed expectations for the Fed Funds rate through December 2017
Average Fed expectations for the Fed Funds rate (1:59)
Lowest of Fed expectations for the Fed funds rate & the first hike since June 2006 16 December 2015 (1:46)
2) CME probability for a US rate hike and when
3) What the Fed Funds rate is, it’s history and how this rate is set
Trading the Fed Funds rate higher requires establishing a short position in the underlying futures contract. As the rate rises the contract price falls to reflect the increase in rate.
To convert the contract price into the rate it represents
Take 100.00 – the contract price = the rate
Example 100.00 – a contract price of 99.46 = a rate of 0.54%
Each 0.01 change in price = $41.67
Contract value at 0.54% = $2,250
4) One easy trade to follow
Trade
Short the CME December 2016 Fed Funds futures contract (ZQZ16)
Price = 99.46
Contract value = $2,250
Rate = 0.54%
Objective
The Fed’s target by 31 December 2016
Objective price = 98.20
Rate = 1.80%
Contract value = $7,500
5) We have 10 Federal Open Market Committee meetings between now and 31 December 2016.
6) Click here to enlarge the Dec. 2016 delivery rate, price, contract valuation chart below
7) Current chart and quotes

8) To experiment with any potential outcome for this trade.
9) Click here and open the interactive risk reward spreadsheet
10) Contact me if you’d like to review any of the spreadsheets enabling you to experiment with any potential outcome for any trade or your own risk/reward criteria.
11) FOMC meeting schedule for setting the Fed Funds rate
12) Inflation Target Of 2% To Become The New Barometer For Further Rate Hikes
Additional trades/spreadsheets
13) 3 Month Rates March, June December Fed Funds March hedge
14) Fed Funds December 2016 2
15) Fed Funds March 2016 S 99.74 (no hedge)
16) Fed Funds December 2016 S 99.46 (no hedge) 100K
17) Fed Funds December 2016 S 99.46 (no hedge) 10K
18) Trading 3 month rates higher through December 2016
19) 3 Month Dec 2017 S 99.70 (no hedge)
20) 3 Month put weighted vol spread Dec 2017
21) 3 Month vol spread Dec 2017
22) 3 Month vol bear spread no hedge Dec 2017
23) 3 Month GEH-M-Z-201616 Fed Funds ZQ-H16 10.05.2015
Fed Funds 1954-2015 cash market and historical price data
25) Click here to enlarge the rate, price contract valuation chart below.
26) Click here for a current chart and the 1954-2015 historical price data

27) The last Fed tightening cycle 2004-2006 from 1.00% to 5.25%
28) Why the Fed hasn’t raised rates (3:04)
Source CME Group
Regards,
Peter Knight Advisor
—————————————————————-
If you have any questions call or email
Regards,
Peter Knight
x
RISK DISCLOSURE STATEMENT
PROGRAM AVAILABILITY IS DEPENDENT ON YOUR COUNTRY OF RESIDENCY AND FINANCIAL STATUS
PAST RESULTS ARE NOT NECESSARILY INDICATIVE OF FUTURE RESULTS. EXAMPLES OF HISTORIC PRICE MOVES OR EXTREME MARKET CONDITIONS ARE NOT MEANT TO IMPLY THAT SUCH MOVES OR CONDITIONS ARE COMMON OCCURRENCES OR ARE LIKELY TO OCCUR.
HYPOTHETICAL PERFORMANCE RESULTS HAVE MANY INHERENT LIMITATIONS, SOME OF WHICH ARE DESCRIBED BELOW. NO REPRESENTATION IS BEING MADE THAT ANY ACCOUNT WILL OR IS LIKELY TO ACHIEVE PROFITS OR LOSSES SIMILAR TO THOSE SHOWN IN FACT, THERE ARE FREQUENTLY SHARP DIFFERENCES BETWEEN HYPOTHETICAL PERFORMANCE RESULTS AND THE ACTUAL RESULTS SUBSEQUENTLY ACHIEVED BY ANY PARTICULAR TRADING PROGRAM. ONE OF THE LIMITATIONS OF HYPOTHETICAL PERFORMANCE RESULTS IS THAT THEY ARE GENERALLY PREPARED WITH THE BENEFIT OF HINDSIGHT.
IN ADDITION, HYPOTHETICAL TRADING DOES NOT INVOLVE FINANCIAL RISK, AND NO HYPOTHETICAL TRADING RECORD CAN COMPLETELY ACCOUNT FOR THE IMPACT OF FINANCIAL RISK IN ACTUAL TRADING. FOR EXAMPLE, THE ABILITY TO WITHSTAND LOSSES OR TO ADHERE TO A PARTICULAR TRADING PROGRAM IN SPITE OF TRADING LOSSES ARE MATERIAL POINTS WHICH CAN ALSO ADVERSELY AFFECT ACTUAL TRADING RESULTS. THERE ARE NUMEROUS OTHER FACTORS RELATED TO THE MARKETS IN GENERAL OR TO THE IMPLEMENTATION OF ANY SPECIFIC TRADE PROGRAM WHICH CANNOT BE FULLY ACCOUNTED FOR IN THE PREPARATION OF THE HYPOTHETICAL PERFORMANCE RESULTS AND ALL OF WHICH CAN ADVERSELY AFFECT ACTUAL TRADING RESULTS.
BID/ASK SPREADS, BROKERAGE COMMISSION, CLEARING, EXCHANGE AND REGULATORY FEES WILL HAVE AN ADVERSE IMPACT ON THE NET OVERALL PERFORMANCE OF YOUR ACCOUNT. PRIOR TO MAKING A DECISION TO PARTICIPATE IN ANY INVESTMENT MAKE SURE YOU FULLY UNDERSTAND THE FEES ASSOCIATED WITH TRADING.
THE INFORMATION PROVIDED IN THIS REPORT CONTAINS RESEARCH, MARKET COMMENTARY AND TRADE RECOMMENDATIONS. YOU MAY BE SOLICITED FOR AN ACCOUNT BY ONE OF OUR REPRESENTATIVES OR EMPLOYEES. IT SHOULD BE KNOWN THAT THE REPRESENTATIVES OF OUR FIRM MAY TRADE FUTURES AND OPTIONS FOR THEIR OWN ACCOUNTS OR THOSE OF OTHERS. DUE TO VARIOUS FACTORS (SUCH AS MARGIN REQUIREMENTS, RISK FACTORS, TRADING OBJECTIVES, TRADING INSTRUCTIONS, TRADING STRATEGIES, AND OTHER FACTORS) SUCH TRADING MAY RESULT IN THE LIQUIDATION OR INITIATION OF FUTURES OR OPTIONS POSITIONS THAT DIFFER FROM THE OPINIONS AND RECOMMENDATIONS FOUND IN THIS REPORT.
PAST PERFORMANCE IS NOT NECESSARILY INDICATIVE OF FUTURE PERFORMANCE. THE RISK OF LOSS IN TRADING FUTURES CONTRACTS OR COMMODITY OPTIONS CAN BE SUBSTANTIAL, AND THEREFORE INVESTORS SHOULD UNDERSTAND THE RISKS INVOLVED IN TAKING LEVERAGED POSITIONS AND MUST ASSUME RESPONSIBILITY FOR THE RISKS ASSOCIATED WITH SUCH INVESTMENTS AND FOR THEIR RESULTS.
YOU SHOULD CAREFULLY CONSIDER WHETHER SUCH TRADING IS SUITABLE FOR YOU IN LIGHT OF YOUR CIRCUMSTANCES AND FINANCIAL RESOURCES.
Long 100 shares XYZ stock
Short 1 XYZ 115 call
Long 1 XYZ 85 put
Call strike – stock purchase price – net premium paid
OR
Call strike – stock purchase price + net credit recieved
Stock purchase price – put strike – net premium paid
OR
Stock purchase – put strike + net credit received
An investor writes a call option and buys a put option with the same expiration as a means to hedge a long position in the underlying stock. This strategy combines two other hedging strategies: protective puts and covered call writing.
Usually, the investor will select a call strike above and a long put strike below the starting stock price. There is latitude, but the strike choices will affect the cost of the hedge as well as the protection it provides. These strikes are referred to as the ‘floor’ and the ‘ceiling’ of the position, and the stock is ‘collared’ between the two strikes.
The put strike establishes a minimum exit price, should the investor need to liquidate in a downturn.
The call strike sets an upper limit on stock gains. The investor should be prepared to relinquish the shares if the stock rallies above the call strike.
In return for accepting a cap on the stock’s upside potential, the investor receives a minimum price where the stock can be sold during the life of the collar.
Outlook
For the term of the option strategy, the investor is looking for a slight rise in the stock price, but is worried about a decline.
The investor adds a collar to an existing long stock position as a temporary, slightly less-than-complete hedge against the effects of a possible near-term decline. The long put strike provides a minimum selling price for the stock, and the short call strike sets a maximum profit price. To protect or collar a short stock position, an investor could combine a long call with a short put.
This strategy is for holders or buyers of a stock who are concerned about a correction and wish to hedge the long stock position.
N/A
The maximum loss is limited for the term of the collar hedge. The worst that can happen is for the stock price to fall below the put strike, which prompts the investor to exercise the put and sell the stock at the ‘floor’ price: the put strike. If the stock had originally been bought at a much lower price (which is often the case for a long-term holding), this exit price might actually result in a profit. The short call would expire worthless.
The actual loss (profit) would be the difference between the floor price and the stock purchase price, plus (minus) the debit (credit) from establishing the collar hedge.
The maximum gain is limited for the term of the strategy. The short-term maximum gains are reached just as the stock price rises to the call strike. The net profit remains the same no matter how much higher the stock might close; only the position outcome might differ.
If the stock is above the call strike at expiration, the investor will likely be assigned on the call and liquidate the stock at the ‘ceiling’: the call strike. The profit would be the ceiling price, less the stock purchase price, plus (minus) the credit (debit) from establishing the collar hedge.
If the stock were to close exactly at the call strike, it would expire worthless, and the stock would probably remain in the account. The profit/loss leading up to that point would be identical, but from that day forward the investor would still continue to face a stock owner’s risks and rewards.
Profit/Loss
This strategy establishes a fixed amount of price exposure for the term of the strategy. The long put provides an acceptable exit price at which the investor can liquidate if the stock suffers losses. The premium income from the short call helps pay for the put, but simultaneously sets a limit to the upside profit potential.
Both the potential profit and loss are very limited, depending on the difference between the strikes. Profit potential is not paramount here. This is, after all, a hedging strategy. The issues for the protective collar investor concern mainly how to balance the level of protection against the cost of protection for a worrisome period.
Breakeven
In principle, the strategy breaks even if, at expiration, the stock is above (below) its initial level by the amount of the debit (credit). If the stock is a long-term holding purchased at a much lower price, the concept of breakeven isn’t relevant.
Volatility
Volatility is usually not a major consideration in this strategy, all things being equal. Since the strategy involves being long one option and short another with the same expiration (and generally equidistant from the stock value), the effects of implied volatility shifts may offset each other to a large degree.
Time Decay
Usually not a major consideration. Since the strategy involves being long one option and short another with the same expiration (and generally equidistant from the stock value), the effects of time decay should roughly offset each other.
Assignment Risk
Yes. Early assignment of the short call option, while possible at any time, generally occurs only just before the stock goes ex-dividend.
And be aware, a situation where a stock is involved in a restructuring or capitalization event, such as for example a merger, takeover, spin-off or special dividend, could completely upset typical expectations regarding early exercise of options on the stock.
Expiration Risk
The option writer cannot know for sure whether or not assignment actually occurred on the short call until the following Monday. However, this is generally not an issue since the investor has stock to deliver if assigned on the call.
Comments
This strategy lends itself to use as a LEAPS® hedge, where time value tends to make premiums higher and the period of protection is longer. The collar offers more protection than a covered call, but at a lower up-front cost than a protective put. See both of these alternatives for additional details.
RISK DISCLOSURE STATEMENT
PROGRAM AVAILABILITY IS DEPENDENT ON YOUR COUNTRY OF RESIDENCY AND FINANCIAL STATUS
PAST RESULTS ARE NOT NECESSARILY INDICATIVE OF FUTURE RESULTS. EXAMPLES OF HISTORIC PRICE MOVES OR EXTREME MARKET CONDITIONS ARE NOT MEANT TO IMPLY THAT SUCH MOVES OR CONDITIONS ARE COMMON OCCURRENCES OR ARE LIKELY TO OCCUR.
HYPOTHETICAL PERFORMANCE RESULTS HAVE MANY INHERENT LIMITATIONS, SOME OF WHICH ARE DESCRIBED BELOW. NO REPRESENTATION IS BEING MADE THAT ANY ACCOUNT WILL OR IS LIKELY TO ACHIEVE PROFITS OR LOSSES SIMILAR TO THOSE SHOWN IN FACT, THERE ARE FREQUENTLY SHARP DIFFERENCES BETWEEN HYPOTHETICAL PERFORMANCE RESULTS AND THE ACTUAL RESULTS SUBSEQUENTLY ACHIEVED BY ANY PARTICULAR TRADING PROGRAM. ONE OF THE LIMITATIONS OF HYPOTHETICAL PERFORMANCE RESULTS IS THAT THEY ARE GENERALLY PREPARED WITH THE BENEFIT OF HINDSIGHT.
IN ADDITION, HYPOTHETICAL TRADING DOES NOT INVOLVE FINANCIAL RISK, AND NO HYPOTHETICAL TRADING RECORD CAN COMPLETELY ACCOUNT FOR THE IMPACT OF FINANCIAL RISK IN ACTUAL TRADING. FOR EXAMPLE, THE ABILITY TO WITHSTAND LOSSES OR TO ADHERE TO A PARTICULAR TRADING PROGRAM IN SPITE OF TRADING LOSSES ARE MATERIAL POINTS WHICH CAN ALSO ADVERSELY AFFECT ACTUAL TRADING RESULTS. THERE ARE NUMEROUS OTHER FACTORS RELATED TO THE MARKETS IN GENERAL OR TO THE IMPLEMENTATION OF ANY SPECIFIC TRADE PROGRAM WHICH CANNOT BE FULLY ACCOUNTED FOR IN THE PREPARATION OF THE HYPOTHETICAL PERFORMANCE RESULTS AND ALL OF WHICH CAN ADVERSELY AFFECT ACTUAL TRADING RESULTS.
BID/ASK SPREADS, BROKERAGE COMMISSION, CLEARING, EXCHANGE AND REGULATORY FEES WILL HAVE AN ADVERSE IMPACT ON THE NET OVERALL PERFORMANCE OF YOUR ACCOUNT. PRIOR TO MAKING A DECISION TO PARTICIPATE IN ANY INVESTMENT MAKE SURE YOU FULLY UNDERSTAND THE FEES ASSOCIATED WITH TRADING.
THE INFORMATION PROVIDED IN THIS REPORT CONTAINS RESEARCH, MARKET COMMENTARY AND TRADE RECOMMENDATIONS. YOU MAY BE SOLICITED FOR AN ACCOUNT BY ONE OF OUR REPRESENTATIVES OR EMPLOYEES. IT SHOULD BE KNOWN THAT THE REPRESENTATIVES OF OUR FIRM MAY TRADE FUTURES AND OPTIONS FOR THEIR OWN ACCOUNTS OR THOSE OF OTHERS. DUE TO VARIOUS FACTORS (SUCH AS MARGIN REQUIREMENTS, RISK FACTORS, TRADING OBJECTIVES, TRADING INSTRUCTIONS, TRADING STRATEGIES, AND OTHER FACTORS) SUCH TRADING MAY RESULT IN THE LIQUIDATION OR INITIATION OF FUTURES OR OPTIONS POSITIONS THAT DIFFER FROM THE OPINIONS AND RECOMMENDATIONS FOUND IN THIS REPORT.
PAST PERFORMANCE IS NOT NECESSARILY INDICATIVE OF FUTURE PERFORMANCE. THE RISK OF LOSS IN TRADING FUTURES CONTRACTS OR COMMODITY OPTIONS CAN BE SUBSTANTIAL, AND THEREFORE INVESTORS SHOULD UNDERSTAND THE RISKS INVOLVED IN TAKING LEVERAGED POSITIONS AND MUST ASSUME RESPONSIBILITY FOR THE RISKS ASSOCIATED WITH SUCH INVESTMENTS AND FOR THEIR RESULTS.
YOU SHOULD CAREFULLY CONSIDER WHETHER SUCH TRADING IS SUITABLE FOR YOU IN LIGHT OF YOUR CIRCUMSTANCES AND FINANCIAL RESOURCES.
A bear call spread is a type of vertical spread. It contains two calls with the same expiration but different strikes. The strike price of the short call is below the strike of the long call, which means this strategy will always generate a net cash inflow (net credit) at the outset.
The short call’s main purpose is to generate income, whereas the long call simply helps limit the upside risk.
The profitability of the strategy depends on how much of the initial premium revenue is retained before the strategy is closed out or expires. As the strategy’s name suggests, it does best if the stock stays below the lower strike price for the duration of the options.
Still, an unexpected rally should not provoke a crisis: though the maximum gain of this strategy is very limited, so are potential losses.
It is interesting to compare this strategy to the bear put spread. The profit/loss payoff profiles are exactly the same, once adjusted for the net cost to carry.
The chief difference is the timing of the cash flows. The bear put spread requires a known initial outlay for an unknown eventual return; the bear call spread produces a known initial cash inflow in exchange for a possible outlay later on.
Looking for a decline in the underlying stock’s price during the life of the options. As with any limited-time strategy, the investor’s long-term forecast for the underlying stock isn’t as important, but this is probably not a suitable choice for those who have a bearish outlook past the immediate future. It would take an accurately timed forecast to pinpoint the turning point where a coming short-term rally would turn into a bearish long term.
A bear call spread is a limited-risk, limited-reward strategy, consisting of one short call option and one long call option. This strategy generally profits if the stock price holds steady or declines.
The most it can generate is the net premium received at the outset. If the forecast is wrong and the stock rallies instead, the losses grow only until the long call caps the amount.
The chance to earn income with limited risk, and/or profit from a decline in the underlying stock’s price.
A vertical call spread can be a bullish or bearish strategy, depending on how the strike prices are selected for the long and short positions. See bull call spread for the bullish counterpart.
The maximum loss is limited. The worst that can happen at expiration is for the stock price to be above the higher strike. In that case, the investor will be assigned on the short call, now deep-in-the-money, and will exercise the long call. The simultaneous exercise and assignment will mean selling the stock at the lower strike and buying the stock at the higher strike. The maximum loss is the difference between the two strikes, but it is reduced by the net credit received at the outset.
The maximum gain is limited. The best that can happen at expiration is for the stock to be below both strike prices. In that case, both the short and long call options expire worthless, and the investor pockets the credit received when putting on the position.
Both the potential profit and loss for this strategy are very limited and very well-defined. The initial net credit is the most the investor can hope to make with the strategy. Profits at expiration start to erode if the stock is above the lower strike price, and losses reach their maximum if the stock hits the higher strike price. Above the higher strike price, profits from exercising the long call completely offset further losses on the short call.
The way in which the investor selects the two strike prices determines the maximum income potential and maximum risk. By selecting a lower short call strike and/or a higher long call strike, the investor can increase the initial net premium income. However, it may be interesting to experiment with the Position Simulator to see how such decisions would affect the likelihood of short call assignment and the level of protection in the event of a big rally.
This strategy breaks even at expiration if the stock price is above the lower strike by the amount of the initial credit received. In that case the long call would expire worthless, and the short call’s intrinsic value would equal the net credit.
Breakeven = short call strike + net credit received
Slight, all other things being equal. Since the strategy involves being short one call and long another with the same expiration, the effects of volatility shifts on the two contracts may offset each other to a large degree.
Note, however, that the stock price can move in such a way that a volatility change would affect one price more than the other.
The passage of time helps the position, though not quite as much as it does a plain short call position. Since the strategy involves being short one call and long another with the same expiration, the effects of time decay on the two contracts may offset each other to a large degree.
Regardless of the theoretical impact of time erosion on the two contracts, it makes sense to think the passage of time would be a positive. This strategy generates net up-front premium income, which represents the most the investor can make on the strategy. If there are to be any claims against it, they must be occur by expiration. As expiration nears, so does the date after which the investor is free of those obligations.
Yes. Early assignment, while possible at any time, generally occurs when the stock goes ex-dividend. Be warned, however, that using the long call to cover the short call assignment will require establishing a short stock position for one business day, due to the delay in receiving assignment notification.
And be aware, a situation where a stock is involved in a restructuring or capitalization event, such as for example a merger, takeover, spin-off or special dividend, could completely upset typical expectations regarding early exercise of options on the stock.
Yes. The investor cannot know for sure whether or not they were assigned on the short call until the Monday after expiration. That creates risk. The problem is most acute if the stock is trading just below, at or just above the short call strike.
Say the short call ends up slightly in-the-money, and the investor buys the stock in the market in anticipation of being assigned. If assignment fails to occur, the investor won’t discover the unintended net long stock position until the following Monday and is subject to an adverse move in the stock over the weekend.
There is risk in guessing wrong in the other direction, too. This time, assume the investor bets against being assigned. Come Monday, if assignment occurred after all, the investor is unexpectedly short the stock, and its value may have risen over the weekend.
Two ways to prepare: close the spread out early, or be prepared for either outcome on Monday. Either way, it’s important to monitor the stock, especially over the last day of trading.
x
RISK DISCLOSURE STATEMENT
PAST RESULTS ARE NOT NECESSARILY INDICATIVE OF FUTURE RESULTS. EXAMPLES OF HISTORIC PRICE MOVES OR EXTREME MARKET CONDITIONS ARE NOT MEANT TO IMPLY THAT SUCH MOVES OR CONDITIONS ARE COMMON OCCURRENCES OR ARE LIKELY TO OCCUR.
HYPOTHETICAL PERFORMANCE RESULTS HAVE MANY INHERENT LIMITATIONS, SOME OF WHICH ARE DESCRIBED BELOW. NO REPRESENTATION IS BEING MADE THAT ANY ACCOUNT WILL OR IS LIKELY TO ACHIEVE PROFITS OR LOSSES SIMILAR TO THOSE SHOWN IN FACT, THERE ARE FREQUENTLY SHARP DIFFERENCES BETWEEN HYPOTHETICAL PERFORMANCE RESULTS AND THE ACTUAL RESULTS SUBSEQUENTLY ACHIEVED BY ANY PARTICULAR TRADING PROGRAM. ONE OF THE LIMITATIONS OF HYPOTHETICAL PERFORMANCE RESULTS IS THAT THEY ARE GENERALLY PREPARED WITH THE BENEFIT OF HINDSIGHT.
IN ADDITION, HYPOTHETICAL TRADING DOES NOT INVOLVE FINANCIAL RISK, AND NO HYPOTHETICAL TRADING RECORD CAN COMPLETELY ACCOUNT FOR THE IMPACT OF FINANCIAL RISK IN ACTUAL TRADING. FOR EXAMPLE, THE ABILITY TO WITHSTAND LOSSES OR TO ADHERE TO A PARTICULAR TRADING PROGRAM IN SPITE OF TRADING LOSSES ARE MATERIAL POINTS WHICH CAN ALSO ADVERSELY AFFECT ACTUAL TRADING RESULTS. THERE ARE NUMEROUS OTHER FACTORS RELATED TO THE MARKETS IN GENERAL OR TO THE IMPLEMENTATION OF ANY SPECIFIC TRADE PROGRAM WHICH CANNOT BE FULLY ACCOUNTED FOR IN THE PREPARATION OF THE HYPOTHETICAL PERFORMANCE RESULTS AND ALL OF WHICH CAN ADVERSELY AFFECT ACTUAL TRADING RESULTS.
BID/ASK SPREADS, BROKERAGE COMMISSION, CLEARING, EXCHANGE AND REGULATORY FEES WILL HAVE AN ADVERSE IMPACT ON THE NET OVERALL PERFORMANCE OF YOUR ACCOUNT. PRIOR TO MAKING A DECISION TO PARTICIPATE IN ANY INVESTMENT MAKE SURE YOU FULLY UNDERSTAND THE FEES ASSOCIATED WITH TRADING.
THE INFORMATION PROVIDED IN THIS REPORT CONTAINS RESEARCH, MARKET COMMENTARY AND TRADE RECOMMENDATIONS. YOU MAY BE SOLICITED FOR AN ACCOUNT BY ONE OF OUR REPRESENTATIVES OR EMPLOYEES. IT SHOULD BE KNOWN THAT THE REPRESENTATIVES OF OUR FIRM MAY TRADE FUTURES AND OPTIONS FOR THEIR OWN ACCOUNTS OR THOSE OF OTHERS. DUE TO VARIOUS FACTORS (SUCH AS MARGIN REQUIREMENTS, RISK FACTORS, TRADING OBJECTIVES, TRADING INSTRUCTIONS, TRADING STRATEGIES, AND OTHER FACTORS) SUCH TRADING MAY RESULT IN THE LIQUIDATION OR INITIATION OF FUTURES OR OPTIONS POSITIONS THAT DIFFER FROM THE OPINIONS AND RECOMMENDATIONS FOUND IN THIS REPORT.
PAST PERFORMANCE IS NOT NECESSARILY INDICATIVE OF FUTURE PERFORMANCE. THE RISK OF LOSS IN TRADING FUTURES CONTRACTS OR COMMODITY OPTIONS CAN BE SUBSTANTIAL, AND THEREFORE INVESTORS SHOULD UNDERSTAND THE RISKS INVOLVED IN TAKING LEVERAGED POSITIONS AND MUST ASSUME RESPONSIBILITY FOR THE RISKS ASSOCIATED WITH SUCH INVESTMENTS AND FOR THEIR RESULTS.
YOU SHOULD CAREFULLY CONSIDER WHETHER SUCH TRADING IS SUITABLE FOR YOU IN LIGHT OF YOUR CIRCUMSTANCES AND FINANCIAL RESOURCES