
Tag: Peter Knight Advisor
Protected: VBO
EMA videos
Track your allocation’s performance with 15 minute updates
1)_Open this page this page, click on sign up

2) Click on get free (it never expires)

3) Enter your name, email, pick a password, create a free account, no additional information is required.

4) login to your Barchart account, under my account click on portfolio

5) Click on new portfolio

6) Name the portfolio

7) Click on create

8) Add a transaction to your EMA portfolio

9) You’ll find the contract code at the beginning of each chart link in column B, if you don’t have an allocation worksheet see this page for one and instructions on how to use it.

10) Enter the contract code

11) Enter date, price, quantity of contracts traded, then apply

12) Once you’ve built out your allocation prices and performance are updated every 15 minutes.
1)_Today’s profit or loss
2) Open trade equity
3) Total profit or loss
4) Current contract price
5) Today’s P&L per market
6) Total P&L per market

13) To offset any positions click on edit

14) Enter the offset price, then apply

15) What you’ll see
1)_Shows net profit or loss
2) Shows the position has been liquidated
3) Total closed adds the offset profit or loss to closed trades

16) To organize the portfolio click on edit

17) Clicking on the arrow or dragging the trade moves the position

18) When finished hit save

19) Portfolio performance is updated every 15 minutes.

If you have any questions, contact me.
 Peter Knight
Voice & Video Chats.
Message me
Bitcoin Futures
Today’s Technical Opinion
3 month chart, daily
Futures Quotes
Option Quotes

1) Simplified Trend Qualification Procedure
1.01) If price action is above the red line and red is above blue = long.
1.02) Risk on long positions, if red moves below blue exit the trade.
1.03) If price action is below the red line and red is below blue = short.
1.04) Risk on short positions, if red moves above blue exit the trade.
1.05) Same rules apply for all time periods using 1 hour to weekly bars.
Prices are updated every 10 minutes, if you have questions contact me.
1.06) Today’s Technical Opinion
1.07) 2 day chart, 15 minute data
1.08) 3 day chart, 30 minute
1.09) 5 day chart, 60 minute data
1.10) 10 day chart, 120 minute
1.11) 3 month chart, daily
1.12) 9 month chart, daily
1.13) Ranges & Price Performance
1.14) Support & Resistance
1.15) Barchart Quotes All Deliveries
1.16) Barchart Options Quotes
1.17) CME Futures Quotes All Deliveries
1.18) CME Option Quotes (options have no liquidity yet)
1.19) Contract Specifications full size contract (5 bitcoins)
1.20) Contract specifications Micro contract (0.10 Bitcoins)
1.21) Exchange Margin Requirement full size contract (5 bitcoins)
1.22) Exchange Margin Requirement micro contract (0.10 bitcoins)
Educational Resources
Futures Options Currencies Indices Interest Rates Metals Energy
2) General Information on Future Contracts and Futures Options
2.1) Futures Educational Videos (60)
2.2) Futures Options Educational Videos (34)
3) Forex Educational Videos
3.1) Basics of the Futures Markets
3.2) Basics of Futures Options
3.3) Fundamentals and FX Futures
3.4) Trading the FX Markets
3.5) Australian Dollar Futures
3.6) British Pound Futures
3.7) Canadian Dollar Futures
3.8) Japanese Yen Futures
3.9) Euro FX Futures
3.10) Introduction to Order Types
3.11) Detailed Description of Order Types With Examples
3.12) Understanding Futures Margin Requirements
3.13) Understanding Moving Averages
3.14) About Bollinger Bands & How to Set Them
3.15) Understanding Support and Resistance
3.16) Defining Trend, Trade Duration & Number of Contracts Traded
3.17) Explaining Call Options (Short and Long)
3.18) Explaining Put Options (Short and Long)
3.19) Option Collars
3.20) Working Examples of Collaring Positions
3.21) What is the European Central Bank?
3.22) Understanding FX Quote Conventions
3.23) FX Futures Pricing and Basis
3.24) Understanding the FX Delivery & Settlement Process
3.25) Hedging FX Risk
3.26) A Look at FX Exchange For Physical (EFP)
3.27) Futures versus forwards traded on the OTC
3.27) FX Spot Markets vs. Currency Futures
4) Program Structure and Account Opening Procedure
4.1) ATA’s, What They Are and How They Work
4.2) The Fee Structure For This Program
4.3) Defining Overall Risk For Your Account
4.4) Exchanges Traded
4.5) Brokerage Firms
4.6) How Balances Are Guaranteed Plus or Minus Trading
4.7) How To Open An Account
If you have any questions send a message or contact me
Regards,
Peter Knight Advisor
—————————————————————-
What we do, my team researches Hedge Funds, CTAs, objective long/short trading programs and provides access to top the performers through the safest and most capable firms worldwide. All objective trading programs are fully automated through our platform on ChartVPS using CQG integrated client linked to multiple exchange members worldwide
How it works, decide on an allocation or, markets/periods you want to traded, we place, monitor, manage all trades 24 hours a day, markets, periods traded and contact size can be changed at any time.
Define your overall account risk, but it should be realistic, in 2023 with the benefit of hindsight, diversification and optimization a capable analyst with access to 6,200 hedge funds, CTA’s and trading programs could optimize performance and produce an allocation where there are no losing months over a 10 year period.
Our fee structure is based on 5.00% to 12.50% of net new high profits quarterly (depends on start balance).
-
- 0.00% front load.
- 0.00% management fee.
- We pay all server, platform and add on fees.
- Quarterly incentive fees are approved by the client prior to being deducted.
- Allocations can be changed at any time.
- Liquidity 2 to 48 hours in any major currency.
- Minimums $12,500 to $500,000.
How balances are guaranteed plus or minus trading activity
Every firm we use segregates customer accounts, balances are guaranteed plus of minus trading activity the Financial Safeguard System the FSS has protected customer balances for over 100 years with zero defaults, unlike SPIC that protects balances up to 500,000 or FDIC up to 250,000 the FSS has no limit.
To open an account please complete this form my team will match your criteria to a brokerage firm on this list that can accommodate the markets, programs you want to trade and your regulatory jurisdiction.
Educational videos and resources
| 10.01 | Futures General Information |
| 10.02 | Options General Information |
| 10.03 | Stock Index Futures |
| 10.04 | Interest Rate Futures |
| 10.05 | Metals Futures |
| 10.06 | Energy Futures |
| 10.07 | Currency Futures |
| 10.08 | CME Learning Center |
| 10.09 | Futures Fundamentals |
| 10.10 | Education Material |
| 10.11 | Resource Center |
| 10.12 | Research Reports |
| 10.13 | Podcasts |
| 10.14 | Monthly FX Review |
| 10.15 | Media Room |
| 10.16 | Economic reports & data |
In 10 minutes you’ll be able verify 2000-2021 performance and monitor trades forward
We use the same parameters to trade all markets.
Sections in this report
1)_Gold contracts that can be traded automatically in this ATA.
2) 2000-2021 performance summary
3) Performance and data spreadsheets
4) Trading rules
5) Verifying performance
6) How to monitor trades forward,
Charts Cash Market and August Delivery
Current Position – 16 June 2021 – Short $1855.80
7) Trading these parameters, 15 minute to monthly
8) Trading the same parameters on Indices & currencies.

1) Gold contracts that can be traded
2) Performance trading one, 100 ounce contract, no compounding and withdrawing all profits annually.
January 2000 through May 2021 performance
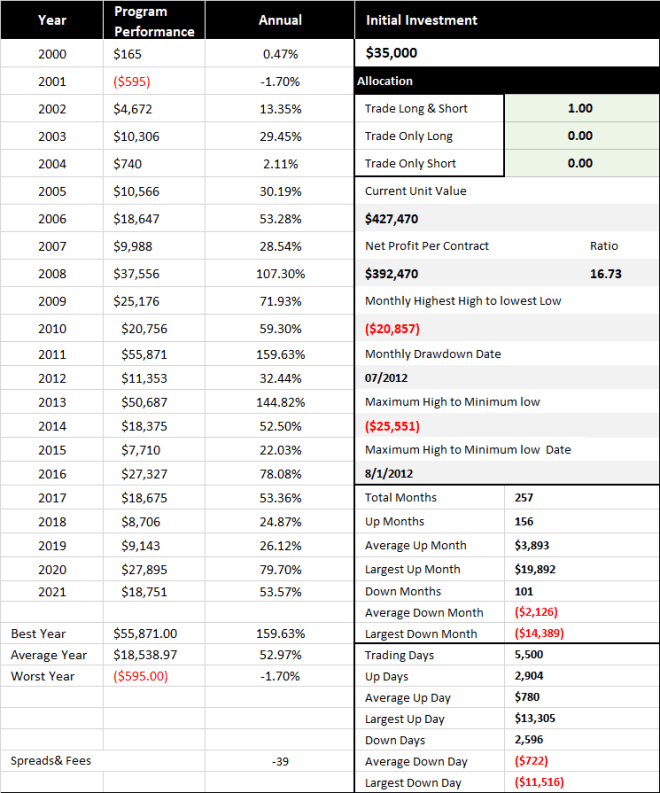
3) The spreadsheets linked below provide 2000-2021 daily and monthly performance, to review open and enable editing.
| Spreadsheet | Margin | Contract Specifications, Quotes and Data | ||
| 100 Ounce | $9,000 | 100 Ounce Gold Contract | ||
| 50 Ounce | $4,500 | 50 Ounce Mini Gold Contract | ||
| 10 Ounce | $900 | 10 Ounce Micro Gold Contract | ||
4) Linked in column K are monthly charts from 2000-2021, trading parameters preset.

5) This strategy has only two rules
5.1) If the EMA 9 shown by the red line is above the EMA18 in blue go long
5.2) If the EMA 9 shown by the red line is below EMA 18 in blue trade short
The chart below is linked here and on the spreadsheet in cell K-36.

6) Verifying performance
Using the charts linked in column K apply the trading rules defied in 5 above and you’ll be able to verify all trades in column L, short positions are represented in red by a -1, long positions by 1 in green.

Daily net profit or loss shows in column M.

Daily net cumulative profit or loss shows in column N.

7) To monitor any EMA forward you can use or daily performance report linked here or set up with Barchart free of charge with performance updated every 15 minutes.
7.01) Instructions to monitor trades using our daily performance update
7.01) Instructions to monitor trades on Barchart with 15 minutes updates
8) The same EMAs will work in any market that moves, linked below is the performance and data spreadsheets trading these same EMAs in indices, metals and currencies.
8.01) 2000-2021 performance for the top 25 EMA allocations
8.02) Create you own EMA allocation
8.03) How to track any any allocation, performance updated every 15 minutes
10) The tricks to being successful trading EMAs,
-
- Proper capitalization (to weather the inevitable drawdowns)
- Only invest true risk capital (to keep the stress level low)
- Unflinching discipline or set it up as an ATA were all trades are automatic
- Diversification
Linked here are some of the more popular EMA ATA allocations.
Linked here are instructions on how to create you’re own EMA ATA allocation.
11) More about Automated Trading Accounts (ATAs)
11.02) What An Automated Trading Account (ATA) Is – How They Work
11.03) ATA Fee Structure
11.04) Defining Overall Risk For Your ATA Account
11.05) How Balances Are Guaranteed Plus or Minus Trading Activity
11.06) How To Open An Account
Debt 20200602
Perception 1970 though 2021
Personal Income, GDP, Federal Revenue, stocks, home prices and precious metals all have outperformed reported inflation.
Average annual reported inflation 4.03%.
Average annual growth in U.S. Personal Income 5.51%
Average annual growth in GDP per capita by 5.14%
Average annual growth in the GDP per employed person 4.70%
Average increase in Federal revenue per capita by 4.99%
Average increase in Federal revenue per employed person by 4.53%
Average increase in Median home prices 5.25%
Average increase in the S&P 500 8.63%
Average increase in Gold 9.81%
2021 has a higher percentage of Americas working than 42 out of the last 52 years
45.19% Percentage of U.S. population is Employed in 2021
1.60% from the 52 year high of 46.79% set in 2000
3.10% higher than the 52 year average of 42.09%
10.84% higher than the 52 year low of 34.35% set in 1971


Overall growth in personal income was 100.72% more than reported inflation
5.51% average annual growth 1970-2020
1.48% Average annual growth above inflation
$29,714 what Personal income would be in 2020 if pegged to inflation
$59,642 Actual personal income in 2020
$29,928 Overall growth in annual personal income above inflation


Overall growth in Federal Income per capita, 44.13% more than reported inflation
4.99% 1970-2020 average annual growth in Federal income per capita
0.96% Average appreciation above inflation
$7,160 What Federal income would be per capita if pegged to inflation
$10,320 Actual Federal income per capita in 2020
Overall growth in Federal income per employed person 20.43% more than inflation
4.99% 1970-2020 average annual growth in Federal income per employed person
0.50% Average appreciation above inflation
$20,093 What Federal income would be per employed if pegged to inflation
$24,197 Actual Federal income per employed person in 2020


Overall growth in GDP per capita 67.16% more than reported inflation
5.14% 1970-2020 average annual growth GDP per capita
1.11% Average appreciation above inflation
$38,551 Is what GDP per capita would be if pegged to inflation
$64,443 Actual GDP per capita in 2020
Overall growth in GDP per employed person 49.33% more than inflation
4.70% 1970-2020 average annual growth GDP per employed person
0.67% Average appreciation above inflation
$101,190 what GDP per employed person would be if pegged to inflation
$151,103 Actual GDP per employed person in 2020


Overall appreciation in median home prices 74.88% more than reported inflation.
5.25% average annual appreciation 1970-2020
1.22% Average appreciation above inflation
$192,671 Is what median home prices would be in 2020 if pegged to inflation
1.22% Average appreciation above inflation
$192,671 Is what median home prices would be in 2020 if pegged to inflation
$336,950 Actual median home price in 2020
$144,279 Overall appreciation in median home prices above inflation
$144,279 Overall appreciation in median home prices above inflation


Overall appreciation of the S&P 500 432.48% more than reported inflation
8.63% average annual appreciation 1970-2020
4.83% Average appreciation above inflation
705.40 Is what the S&P 500 would be in 2020 if pegged to inflation
4.83% Average appreciation above inflation
705.40 Is what the S&P 500 would be in 2020 if pegged to inflation
3,756.10 Actual S&P price in 2020
3,050.70 Overall appreciation of the S&P 500 above inflation
3,050.70 Overall appreciation of the S&P 500 above inflation


Overall appreciation of gold 462.54% more than reported inflation
9.81% average annual appreciation 1970-2020
5.78% Average appreciation above inflation
$315 Is what the price of gold would be in 2020 if pegged to inflation
5.78% Average appreciation above inflation
$315 Is what the price of gold would be in 2020 if pegged to inflation
$1,772 Actual price of gold in 2020
$1,457 Overall appreciation of gold above inflation
$1,457 Overall appreciation of gold above inflation

How can Personal Income, GDP, Federal Revenue, stocks, home prices and precious metals all outperform reported inflation.
Average annual reported inflation 4.03%.
Average annual growth in U.S. Personal Income 5.51%
Average annual growth in GDP per capita by 5.14%
Average annual growth in the GDP per employed person 4.70%
Average increase in Federal revenue per capita by 4.99%
Average increase in Federal revenue per employed person by 4.53%
Average increase in Median home prices 5.25%
Average increase in the S&P 500 8.63%
Average increase in Gold 9.81%
2021 a higher percentage of Americans are employed than 42 out of the last 52 years.
And the U.S. ends up with this mess?
26.5 trillion in new Federal debt
9.163 trillion in Federal Reserve bailouts to keep the U.S. solvent
7.922 of the 9.163 trillion of bailouts funded with Fed created money
1.241 of the 9.163 trillion in bailouts funded by forfeited Fed operating profits
148.084 trillion in unfunded liabilities
2 debt downgrades with at least one more on deck
Artificially low interest rates that have stripped savers of trillions
And inflation magically disappears and real rates of return go below zero?
8.70% average Treasury rate, 1970 – 2007, 3.99% more than reported inflation
2.67% Average Treasury rate since 2008, 0.94% more than reported inflation
2.01% average treasury rate in 2021 2.19% less than inflation


Reported inflation is fictional or everything wouldn’t be out pacing reported inflation.
Average reported Inflation 4.03%
Per capita annual growth in Federal revenue 4.99%
Per capita average annual growth in Federal spending 6.82%
Per employed person average annual growth in Federal revenue 4.53%
Per employed person annual growth in Federal spending 6.51%
Per employed person revenue in 2020 $24,196
Per employed person Federal spending in 2020 $53,647
$53,647 in Federal spending per employed person in 2020 was equivalent to 89.95% of Average U.S. Personal Income in 2020 of $59,642.


To appreciate how absurd BLS reported inflation has become compare the actual fiscal cost of the New Deal and and World War 2 to what the BLS tells us they would cost today.
New Deal
Total cost of the New Deal from 1933 to 1936 dollars was 41.70 billion , according this BLS inflation calculator this translates into 836.77 billion in 2021 dollars or 10.96% of what the Federal government spent 2020,
BLS inflation calculation magic also tells us the total cost of of Roosevelt’s new deal in 2021 dollars is equivalent to 4.67% of the increase in Federal Debt from 2008 through 2020, that this 17.930 trillion could had fully funded the New Deal 21 times over.

During the New Deal from 1933-1939 Federal debt per capita increased by $129.00 from $179.14 dollars to $308. The BLS translates this to an increase of $2,588.48 in 2021 dollars, from $3,595 to $6,183.
In the last 16 months Federal per capita debt increased by $16,831
What the New Deal did & funded.
-
- Jobs for a total of 8.5 million Americans, 6.39% of the population.
- The majority of the jobs trained unskilled men to learn a new profession as they carried out public works infrastructure projects.
- Built or modernized more than 55,000 civilian and military buildings
- Built 32 navel vessels, many played key roles during World War 2.
- 4,026 new schools, the majority are still open today
- 130 new hospitals, including Fitzsimons , Allegheny General & Jersey City Medical Center.
- More than 29,000 new bridges and tunnels including the Lincoln Tunnel, Throgs Neck and Golden Gate bridges.
- Scores of Dams including Hover and Shasta, the majority still produce Hydro Electric Power today.
- Built or modernized over 180,000 miles of Highway, including the Los Angeles Freeway and Overseas Highway.
- Built or modernized more than 150 airports including La Guardia and Midway.
- Built or modernized nearly 9,000 miles of storm drains and sewer lines.
New Deal Programs provided more than Infrastructure
-
- The laborers of the New Deal programs worked in schools serving more than 900 million hot lunches to hungry children during the depression.
- Operated 1,500 nurseries enabling childcare so parents could work.
- Funded over 225,000 concerts and thousands of plays.
- The New Deal cultural programs produced more than half a million works of art including Jackson Pollock’s 17A which sold for 200 million in 2016.
- The New Deal Writers’ Program featured pieces from soon-to-be famous Authors like John Steinbeck, Steinbeck went on to win the Pulitzer Prize in 1940 for his novel The Grapes of Wrath.
Compare Roosevelt’s New Deal did for the United States from 1933 to 1939 versus what politicians (on both sides) have done with the trillions they’ve already spent. Where are the new hydro electric dams, new schools, hospitals, roads, bridges, tunnels, high speed trains, training and jobs for the unemployed, detox programs and homes for the homeless?
Fiscal Cost of World War 2 to what the BLS tells us it would cost today.
61 countries participated in World War 2 to protect the world from Hitler’s Socialist agenda, Mussolini’s Fascist and Hirohito’s aristocratic oligarchy.
The U.S.’s participation from 1941 to 1945 had a total fiscal cost of 291.18 billion dollars.The BLS.GOV tells us 291.18 billion in 1942 translates into 4,912.54 billion today or 64.37% of what the Federal Government spent in 2020.
From 1941 through 1945 Federal debt per capita went up by $1,455.72, from $383.61 to $1,839.33, BLS translates this into 2021 dollars to up $24,876.56 from $6,555.45 to $31,432.01.
Since 2017 U.S. Federal debt per capita has increased by $25,389.99.
BLS tells us the combined fiscal cost of the New deal and World War 2 would be 5.749 trillion in 2021 dollars equivalent to 75.34% of what the Federal Government spent last year.
xxxxxxxxxxxxxxxxxxxxxxxxxxxxxxxxxxxxxxxxxxxxxxxxxxxxxxxxxxxxxxxxxxxxxxxxxxxxxxxxxxxxxxxxxxxxxxxxxxxxxxxx
Start here ended 2020602
Why would the U.S. misrepresent inflation?
Record deficit spending and the creation of money to finance it has reduced annual Federal revenue a to a mere 11.16% of total Federal Debt.
60.24% 1970-2021 high in 1981
31.73% Average revenue to debt ratio
11.16% 1970 to 2021 low 2021
31.73% Average revenue to debt ratio
11.16% 1970 to 2021 low 2021

This 11.16% ratio makes it impossible for the U.S. to accurately report inflation, normalize interest rates or any Federal expense whose increase is pegged to reported inflation such as Social Security, Medicare, Military or Civilian employee pensions and public assistance programs like welfare which the Federal Governments funds and the States administer.
Federal spending from 1970 through 2007 outpaced annual Federal revenue by XXX
New Federal debt 1970 through 2007 grew from X to Y per capita and x per y per employed person
From 1970 though 2007 the Fed created a net total of X for Corporate and Treasury bailouts
By 1990 Investment banks like Bear Stearns, American International Group, Morgan Stanley, Goldman Sachs and Bank of America were discovering the profitability of Mortgage Backed Securities by 200 they were raising trillions and funneling it to lenders, as the market became saturated borrowing qualifications disappeared, by 2007 nearly anyone with a pulse could qualify for up to a $650,000 mortgage.
Total mortgage debt in the United States went from 3.790 trillion in 1990 to 6.767 trillion in 2000, by 2007 14,964 trillion, up 10.904 trillion +287.69%.


2000
Mortgage debt 496.38% of annual personal income
Mortgage delinquency rates 2.23%
2007
Mortgage debt 803.39% of annual personal income
Mortgage delinquency rates 3.10%
During 2007 & 2008 home prices declined from x to Y
2008
Mortgage debt 781.31% of annual personal income
Mortgage delinquency rates soar to 6.57%
with a delinquency rate of 2.23% in 2000 to 803.39% with a delinquency rate by 2007 delinquency rate moved to


From 200 though 2010 the Fed created a net total of X for Corporate and Treasury bailouts
Federal spending from January 2019 through May 2020 outpaced annual Federal by XXX
New Federal debt from January 2019 through May 2020 grew from X to Y per capita and per employed person. to YY
From January 2019 through May 2020 the Fed created a net total of X for Corporate and Treasury bailouts
revenue, in 2020 – 2021 it’s running at 219.23% of total Federal Revenue.
Dollar devaluation this is what’s pushed assets and personal income higher, it certainly hasn’t been the glowing economic fundamentals or fiscal restraint of the 21st century.
The dollar’s decline hasn’t been against currencies of other countries just as addicted to spending and debt as the U.S. but quality stocks, precious metals, real estate and nearly every tangible asset.
Debt 20200530
Keep it organized and to the point don’t be repetitive
Dollar devaluation is pushing the market higher not the glowing economic fundamentals or fiscal restraint of the 21st century.
Dollar devaluation hasn’t been against the currencies of other countries just as addicted to spending and debt as the U.S. but quality stocks, precious metals, real estate and nearly every tangible asset.
The dollar’s decline is being fueled by Absurd Federal Spending and Federal Reserve’s creation of money. Initial justification for the creation for creation of money resulting in debt monetization was the financial crisis starting in 2008. From 2008 through 2019 the Federal Reserve created
2008 – 2019
55.319 trillion dollars in Federal Spending
17.930 trillion in New Federal Debt


17.930 trillion in new Federal debt is greater than the total debt of the United Kingdom, Ireland, Greece, Norway, Russia, Australia, China, South Korea, Taiwan, Canada, Mexico, Argentina and Nigeria combined. Combined population of these countries 2.198 billion.
4.166 trillion total Money created by the Federal Reserve
1.650 of the 4.165 trillion went to buy bad debt in the private sector.
2.516 of the 4.165 trillion to buy U,S. Treasury debt the free market wouldn’t.
The Fed’s money creation timeline emphasizes how the Treasury’s dependence on the Federal Reserve bailouts has escalated.
771 billion 1913 – 2007 was created by the Fed for Bank & Treasury bailouts.
3.441 trillion 2008 – 2019
Where record deficit spending has left the United States.
In 2020 annual Federal revenue is now a mere 11.16% of total Federal debt down from 50.62% of total Federal debt in 1970
60.24% 1970-2021 high year 1981
31.73% Average 1970 2020 annual revenue to total federal debt ratio
11.16% Record low year 2021
31.73% Average 1970 2020 annual revenue to total federal debt ratio
11.16% Record low year 2021

The 11.16% annual Federal revenue to total Federal debt ratio makes it impossible for the U.S. to accurately report inflation, normalize interest rates or any Federal expense whose increase is pegged to reported inflation such as Social Security, Medicare, Military or Civilian employee pensions. If interest rates normalized in 2021 to the 1970 – 2007 average of 8.70%, 68% of total Federal Revenue would be consumed by Federal debt service costs.
How did this ratio get so ugly when GDP, income, assets and Federal revenue all outpaced reported inflation from 1970 through 2021?
Average annual reported inflation from 1970 to 2020 4.03%.
Average annual growth in U.S. Personal Income 5.51%
Average increase in Median home prices 5.25%
Average increase in the S&P 500 8.63%
Average increase in Gold 9.81%
Average annual growth in GDP per capita by 5.14%
Average annual growth in the GDP per employed person 4.70%
Average increase in Federal revenue per capita by 4.99%
Average increase in Federal revenue per employed person by 4.53%
2021 has a higher percentage of the population employed and paying taxes than 42 out of the last 52 years.
The numbers on Personal Income
5.51% average annual growth 1970-2020
1.48% Average growth above inflation
$29,714 Is what Personal income would be in 2020 if pegged to inflation
1.48% Average growth above inflation
$29,714 Is what Personal income would be in 2020 if pegged to inflation
$59,642 Actual personal income in 2020
$29,928 Overall growth in annual personal income above inflation
$29,928 Overall growth in annual personal income above inflation
Overall growth in personal income was 100.72% more than reported inflation

Median home prices
5.25% average annual appreciation 1970-2020
1.22% Average appreciation above inflation
$192,671 Is what median home prices would be in 2020 if pegged to inflation
1.22% Average appreciation above inflation
$192,671 Is what median home prices would be in 2020 if pegged to inflation
$336,950 Actual median home price in 2020
$144,279 Overall appreciation in median home prices above inflation
$144,279 Overall appreciation in median home prices above inflation
Overall appreciation in median home prices was 74.88% more than reported inflation.

S&P 500
8.63% average annual appreciation 1970-2020
4.83% Average appreciation above inflation
705.40 Is what the S&P 500 would be in 2020 if pegged to inflation
4.83% Average appreciation above inflation
705.40 Is what the S&P 500 would be in 2020 if pegged to inflation
3,756.10 Actual S&P price in 2020
3,050.70 Overall appreciation of the S&P 500 above inflation
3,050.70 Overall appreciation of the S&P 500 above inflation
Overall appreciation of the S&P 500 was 432.48% more than reported inflation

Gold
9.81% average annual appreciation 1970-2020
5.78% Average appreciation above inflation
$315 Is what the price of gold would be in 2020 if pegged to inflation
5.78% Average appreciation above inflation
$315 Is what the price of gold would be in 2020 if pegged to inflation
$1,772 Actual price of gold in 2020
$1,457 Overall appreciation of gold above inflation
$1,457 Overall appreciation of gold above inflation
Overall appreciation of gold was 462.54% more than reported inflation


Growth in GDP Per Capita
5.14% 1970-2020 average annual growth GDP per capita
1.11% Average appreciation above inflation
$38,551 Is what GDP per capita would be if pegged to inflation
$64,443 Actual GDP per capita in 2020
Overall growth in GDP per capita was 67.16% above reported inflation inflation
Growth in GDP Per Employed Person
4.70% 1970-2020 average annual growth GDP per employed person
0.67% Average appreciation above inflation
$101,190 what GDP per employed person would be if pegged to inflation
$151,103 Actual GDP per employed person in 2020
Overall growth in GDP per employed person was 67.16% above inflation

Growth in Federal Revenue Per Capita
4.99% 1970-2020 average annual growth in Federal income per capita
0.96% Average appreciation above inflation
$7,160 What Federal income would be per capita if pegged to inflation
$10,320 Actual Federal income per capita in 2020
Overall growth in Federal income per capita was 44.13% higher then reported inflation
Growth in Federal Revenue Per Employed Person
4.99% 1970-2020 average annual growth in Federal income per employed person
0.50% Average appreciation above inflation
$20,093 What Federal income would be per employed if pegged to inflation
$24,197 Actual Federal income per employed person in 2020
Overall growth in Federal income per employed person was 20.43% higher than reported inflation

45.19% Percentage of U.S. population is Employed in 2021
1.60% from the 52 year high of 46.79% set in 2000
3.10% higher than the 52 year average of 42.09%
10.84% higher than the 52 year low of 34.35% set in 1971
In 2021 a higher percentage of the U.S. population has jobs than 42 out of the last 52 years.
The official current unemployment is 6.10%, a 6.10 % unemployment rate is higher than 30 out of the last 52 years.

Perception
With growth in GDP, Personal Income, assets and Federal Revenue all outpacing reported in Inflation and a higher percentage of the population working now than 42 out of the last 52 years you’d expect the quality of life in the United States to be at or near an all time high, the Federal Government should be running budget surpluses, retiring debt and working on restoring their AAA credit rating.
Average annual reported BLS inflation from 1970 to 2020 4.03%.
Average annual growth in U.S. Personal Income 5.51%
Average increase in Median home prices 5.25%
Average increase in the S&P 500 8.63%
Average increase in Gold 9.81%
Average increase in Federal revenue per capita by 4.99%
Average increase in Federal revenue per employed person by 4.53%
Average annual growth in GDP per capita by 5.14%
Average annual growth in the GDP per employed person 4.70%
2021 has a higher percentage of the population employed and paying taxes than 42 out of the last 52 years.
The reality of what these strong numbers produced
A record 26.5 trillion in new Federal debt
9.163 trillion in Federal Reserve bailouts to keep the U.S. solvent
1.241 of the 9.153 trillion of it forfeited Federal Reserve operating profits
7.922 trillion of Fed created money from and backed by nothing
148.084 trillion in unfunded liabilities
2 debt downgrades with at least one more on deck
(During the last financial crisis the U.S lost it’s AAA debt rating for creating 3.441 trillion dollars for bank and Treasury bailouts then labeling it “quantitative easing” quantitative easing and debt monetization are basically the same thing, the creation of money from and backed by nothing to devalue a country’s currency)
Despite this 3.411 trillion in created money 12 years latter the U.S. found itself in yet another financial crisis that over the last 16 months has required 10.107 trillion in Federal spending and 5.655 trillion in new Federal debt.
10.107 trillion in Federal spending over the last 16 months is equivalent to the combined total government debt of the United Kingdom, Canada, Australia, Mexico, Russia and India, combined population of these countries 1.792 billion.
10.107 trillion in 16 months is 2.05 trillion more than China’s total reported debt of 8.057 trillion, population of China 1.422 billion.

Federal spending from 2008 through 2020 has exceeded 55.319 trillion dollars, new Federal debt 17.930 trillion.
Since 1913 the Federal Reserve has created a net total 7.992 trillion from and backed by nothing for Bank, Corporate and Treasury bailouts
2.792 trillion of the total 7.922 trillion went to buy bad bank debt, the majority of this bad debt was from the same banks that caused the 2008 financial crisis, the Fed still owns the majority of this junk debt today.
5.128 trillion to buy Treasury debt the free market wouldn’t

Fed’s money creation timeline 1913 – 2021
771 billion, 1913 – 2007 total created for bank and Treasury bailouts
3.441 trillion 2008 – 2019 for bank and Treasury bailouts
By January 2020 Federal debt had gotten so high, Treasury ratings and yields so low, the U.S. has been unable to sell enough Treasury debt on the open market to to satiate their ever increasing spending addiction.
January 2020 though April 2021
10.107 trillion total Federal Spending
5.671 trillion new Federal debt
3.738 trillion money created by the Fed to buy debt the free market wouldn’t
10.107 trillion is equivalent to the total government debt of the United Kingdom, Canada, Australia, Mexico, Russia and India combined. Total population of these countries 1.792 billion people.
5.671 trillion in new Federal debt is 758 billion in 2021 dollars more than the entire fiscal cost of World War 2 between of 291.18 billion which according the BLS translates into 4.913 trillion in 2021.
3.738 trillion in the last 16 months is 69 billion more than the combined total debt of Brazil, Argentina, Mexico, Russia and Taiwan combined population of these countries 557.865 million.
Out of the 5.671 trillion in new Federal debt the free market would only by 1.933 trillion of it, 65.91% of the 3.738 trillion had to be funded with Fed created money or the U.S. would have been insolvent.

Debt 20200528
Dollar devaluation is pushing the market higher it’s definitely not the glowing economic fundamentals or fiscal restraint of the 21st century.
Dollar devaluation hasn’t been against currencies of other countries just as addicted to spending and debt as the U.S. but quality stocks, precious metals, real estate and nearly every tangible asset.
A 11.16% annual revenue to total debt ratio makes it impossible for the U.S. to accurately report inflation, normalize interest rates or any Federal expense whose increase is pegged to reported inflation such as Social Security, Medicare, Military or Civilian employee pensions. if interest rates did normalized in 2021 to the 1970 – 2007 average of 8.70%, 68% of all Federal Revenue would be consumed by debt service costs.
Ask yourself with Income, assets, Federal revenue all outpacing reported inflation how could the annual Federal revenue to debt ratio deteriorate from from 50.62% in 1970 to a mere 11.16% in 2021?
Average annual reported BLS inflation from 1970 to 202?0 4.03%.
Average annual growth in U.S. Personal Income 5.51%
Average increase in Median home prices 5.25%
Average increase in the S&P 500 8.63%
Average increase in Gold 9.81%
Average increase in Federal revenue per capita by 4.99%
Average increase in Federal revenue per employed person by 4.53%
Average annual growth in GDP per capita by 5.14%
Average annual growth in the GDP per employed person 4.70%
2021 has a higher percentage of the population employed and paying taxes than 42 out of the last 52 years.
Reported Inflation Fact or Fiction?
1970 – 2021 Actual price increases versus price increases if pegged to reported inflation,
Average annual growth in Personal Income from 1970 through 2020 was 5.51% outpacing reported inflation by a strong 1.48%. Personal Income if pegged to inflation it would have been $29,714 in 2020 versus $59,642.
Median home prices have appreciated by an average of 5.25% annually outpacing reported inflation by 1.22%. If pegged to inflation they’d be $192,671 in 2020 not $336,950,
The S&P 500 appreciated by an average of 8.63% annually outpacing reported inflation by 4.83%. If pegged to inflation it would have closed out 2020 at 705.41 not 4,063.04.
Gold has appreciated by an average of 9.81% annually outpacing reported inflation by 5.78%. If pegged to inflation it would closed out 2020 at $315 not $1,867.
GDP per capita & per employed person
From 1970 through 2020 average annual growth in GDP per capita was 5.14% outpacing reported inflation by 1.11%. If pegged to inflation per capita GDP would have been $38,551 in 2020 versus $64,443.
Annual growth in GDP per employed person averaged 4.70% outpacing reported inflation by 0.67%, if pegged to inflation GDP per employed person would have been $108,190 in 2020 versus $151,103.
Federal revenue, per capita & per employed person
Over the last 52 years per capita average annul growth in Federal Income was 4.99% outpacing reported inflation by 0.96%, Federal revenue per capita if pegged to inflation would have been $7,159.71 in 2020 not $10,319.60,
Growth in Federal revenue per employed person averaged 4.53% outpacing reported inflation by 0.50%, if pegged to inflation it would have been $20,093 in 2020 not $24,196.86,
U.S. Employment
In March 2021 45.19% of the U.S. population was employed, a higher percentage than 42 out of the last 52 years, 45.19% is 1.60% from the 52 year high of 46.79% set in 2000 when the U.S. had a balanced budget and 10.84% from the 52 year low of 34.35% set in 1971. Yet the official unemployment rate in March 2021 was 6.10%, a 6.10 % unemployment rate is higher than 30 out of the last 52 years.
Perception
With growth in personal income, homes, assets all outpacing reported inflation, you’d think the quality of life for a U.S. citizens would be at or near an all time high, that citizens would be able to retire debt, have large post inflation gains on their homes and even greater post inflation gains in their portfolios.
With Federal revenue outpacing reported inflation, a higher percentage of the U.S. population employed and paying taxes now than 42 out of the last 52 years you’d assume the U.S. would be running budget surpluses, paying down debt and working towards restoring their credibility along with their AAA debt rating.
The reality of what these numbers produced
A record 26.5 trillion in new Federal debt
9.7 trillion in Federal Reserve bailouts to keep the U.S. solvent
5.128 trillion of created money to buy U.S. debt the free market wouldn’t at rates the Federal Government could afford to pay.
2 debt downgrades with at least one more on deck
148.084 trillion in unfunded liabilities
In just 12 years the U.S. finds itself in yet another financial crisis that over the last 16 months has required 10.107 trillion in Federal spending and 5.655 trillion in new Federal debt.
10.107 trillion is equivalent to the total government debt of the United Kingdom, Canada, Australia, Mexico, Russia and India combined,
10.107 trillion is 2.05 trillion more than China’s total debt of 8.057 trillion.
Federal Revenue & Spending
With revenue outpacing reported inflation by a strong 0.96% per capita and 0.50% per employed person it’s hard to reconcile average Federal spending exceeding revenue by 1.83% per capita and 1.98% per employed person.
Federal spending from 1970 through 2020 averaged 130.75% of annual Federal revenue, in 2020 and 2021 Federal spending is running at 219.23% of total Federal Revenue.
Average reported Inflation 4.03%
Per capita average annual growth in Federal revenue 4.99%
Per capita average annual growth in Federal spending 6.82%
Per employed person average annual growth in Federal revenue 4.53%
Per employed person average annual growth in Federal spending 6.51%
In 2020 Federal spending per employed person was $53,647 equivalent to 89.95% of U.S. personal income of $59,642.
2020 Per capita Federal Revenue $10,319
Per capita Federal spending $22,879
Per employed person Federal revenue $24,196
Per employed person Federal spending $53,647
Increases in Federal Spending
From 2015 through 2019 Total annual Federal spending (all-in) averaged 4.301 trillion.
In 2020 the Federal Government spent 7,631 trillion 3.330 more than the 2015-2019 average,
Final Federal Spending (all in) for 2021 is estimated to equal or exceed 2020’s 7.631 trillion.
The justification Covid-19, what we know in 2021.
According to CDC and WHO prior to 2020 viruses that cause lower respiratory infections were present in an average of 3,190,350 people who die annually.
Covid-19 is a virus that causes respiratory infections and was present in 3,483,529 people who died in 2020.
Total people who died that tested positive for Covid-19 with one or more preexisting condition 3,349,065
Total people who died that tested positive for Covid-19 with no preexisting conditions 134,464.

According to WHO and the CDC a person in 2020 with no preexisting conditions had a 10 times greater chance of dying from a road injury than Covid-19.

Using the Covid-19 pandemic to justify another print and spend party is a new low, even for U.S. politicians.
The way these politicians spent these borrowed trillions is absurd, The they’re financing these trillions through the creation of money from and backed by nothing puts the next U.S. financial crisis squarely on deck.
Over the last 16 months the Federal government spent 10.107 trillion generating 5.67 trillion in new Federal debt during the same period the Federal Reserve created 3.74 trillion to buy Treasury debt the free market wouldn’t.
5.671 in new Federal debt is 742 billion dollars more than the entire fiscal cost of World War 2. in 2021 dollars (Total Fiscal cost of World War 2 between 1941 and 1946 was 291.18 billion according the BLS this translates into 4.913 trillion today)
Since 1913 the Federal Reserve has created a net total 7.992 trillion from and backed by nothing for Bank and Treasury bailouts
771 billion of the 7.92 trillion was created from 1913 through 2007
3.441 of the 7.992 trillion between January 2008 through December 2019
3.780 of the 7.992 trillion during the last 16 months, 3.780 trillion is 339 trillion more than the total between 2008-2019.
By January 2020 Federal debt had gotten so heavy, Treasury rating and yields so low, the U.S. has been unable to sell enough Treasury debt on the open market to to satiate their ever increasing spending addiction.
2.795 of the created 7.922 trillion went to buy bad bank debt, the majority of this bad debt was from the same banks that caused the 2008 financial crisis, the Fed still owns the majority of this junk debt today.
The 7.922 trillion in bank and Treasury bailouts between 2008 and 2021 is on top of the 1.241 trillion in operating profits the Federal Reserve forfeited to the U.S, Treasury during the same period.

Fed’s contribution to keep the U.S. solvent before and after 2008
From 1913 through 2007 the Federal Reserve’s total contribution to keep the U.S. solvent was net 771 billion dollars.
Since 2008 8.392 trillion to keep the U.S. solvent.
Unprecedented spike higher in M1
Over the last 58 weeks M1 has spiked 385.35% higher from 4.774 trillion to 19.156 trillion, yes other countries are doing the same thing that doesn’t make it right.

As Federal debt soared inflation and real rates of return magically disappeared
From 1970 through 2007 Treasuries had an average yield of 8.70% and paid an average of 3.99% more than reported inflation (3.99% real rate of return),
The average yield since 2008 2.67% paying 0.94% more than reported inflation.
The current average Treasury yield 2.01% paying 2.19% less than reported inflation.
Ask yourself, does it make any sense Federal spending, Federal debt and the creation of money all hit a historic highs while inflation hit a historic low?
The only explanation for this aberration is reported inflation is fictional.
To appreciate just how absurd BLS reported inflation has become compare the total cost of Roosevelt’s New Deal from 1933-1939 to what BLS inflation calculations tell it would cost in 2021.
New Deal
Total cost of the New Deal from 1933 to 1939 was 41.70 billion , according the BLS this translates into 836.77 billion in 2021 dollars or 10.96% of what the Federal government spent in 2020, 17.91% of total spending in 2019.
During the new deal Federal debt per capita increased by $129.00 from $179.14 in 1933 to $308.14 by the end of 1939. BLS inflation calculations tell us this translates into an increase Federal dent per capita of $2,588.48, from $3,594.79 to $6,183.27.
In the the last 16 months Federal debt per capita has increased by $16,831 or 272.21% of what Federal Debt increased by per capita during the New Deal that built America’s infrastructure and prepared it for World War 2 from 1933 through 1939.
What the New Deal did and funded
-
- Jobs for a total of 8.5 million Americans, 6.39% of the population.
- The majority of the jobs trained unskilled men to learn a new profession as they carried out public works infrastructure projects.
- Built or modernized more than 55,000 civilian and military buildings
- Built ordinance manufacturing facilities preparing for World War 2
- Built 32 navel vessels, many played key roles during World War 2.
- Built or modernized 4,026 schools, the majority are still open today
- 130 new hospitals, including Fitzsimons , Allegheny General & Jersey City Medical Center.
- More than 29,000 new bridges and tunnels including the Lincoln Tunnel, Throgs Neck and Golden Gate bridges.
- Scores of Dams including Hover and Shasta, the majority still produce Hydro Electric Power today.
- Built or modernized over 180,000 miles of Highways, including the Los Angeles Freeway and Overseas Highway.
- Built or modernized more than 150 airports including La Guardia and Midway.
- Built or modernized nearly 9,000 miles of storm drains and sewer lines.
New Deal Programs provided more than Infrastructure
-
- The laborers of the New Deal programs worked in schools serving more than 900 million hot lunches to hungry children during the depression.
- Operated 1,500 nurseries enabling childcare so parents could work.
- Funded over 225,000 concerts and thousands of plays.
- The New Deal cultural programs produced more than half a million works of art including Jackson Pollock’s 17A which sold for 200 million in 2016.
- The New Deal Writers’ Program featured pieces from soon-to-be famous Authors like John Steinbeck, Steinbeck went on to win the Pulitzer Prize in 1940 for his novel The Grapes of Wrath.
Or comparing the total fiscal Cost of World War 2 to what BLS inflation calculations tell us it would cost in 2021.
61 countries participated in World War 2 to protect the world from Hitler’s Socialist agenda, Mussolini’s Fascist and Hirohito’s aristocratic oligarchy.
The U.S.’s participation from 1941 to 1945 had a total fiscal cost of 291.18 billion. BLS.GOV inflation calculations tell us this 291.18 billion in 1942 translates into 4,912 trillion 2021 or 64.37% of what the Federal Government spent in 2020.
From 1941 through 1945 Federal debt per capita increased by $1,455.72 from $383.61 to $1,839.33. BLS inflation calculation translates this to an increase if $24,876.56 from $6,555.45 to $31,432.01 in 2021 dollars.
In the last 4 years U.S. Federal debt per capita has increased by $25,389.99 or $513.43 more in 2021 dollars than the increase in Federal debt per capita from 1941 through 1945.
BLS calculations tell us the combined fiscal cost of the new deal and world war 2 would be 5.749 trillion in 2021 dollars equivalent to 75.34% of what the Federal Government spent in 2020 and wants to spend in 2021.
Purpose of reporting fictional inflation reporting
Lower inflation translates into trillions in contained costs on all Federal expenditures pegged to the official inflation rate such as Social Security, Medicare, Military and Civilian Employee Pensions and Treasury rate that determine debt service cost.
Impact on Federal debt service cost.
From 1970 through 2020 total Federal debt increased from $380.91 billion to $26,880.92 billion up 8,098.94%.
Federal debt service cost during the same period increased from $34.64 billion to $538.45 billion up 1,454.25%.
From 2008 through 2020 total Federal debt increased from $8,950.75 billion to $26,880.92 billion up 200.32%, annual Federal debt service cost during the same period increased from $411.21 billion to $538.45 billion up 30.91%.

Medicare
From 1970 through 2007 annual medicare expenditures per capita increased by an average of 10.73% reported inflation during the same period averaged 4.70%
From 2008 through 2021 annual medicare expenditures per capita increased by only 4.37% reported inflation during the same period 1.90% annually.
Total medicare expenditures are estimated to come in at 732.50 billion in 2021 and are expected to increase to 925.51 billion by 2025.
According to the 2020 Social Security Trustees Report all medicare reserve funds will be entirely depleted by 2026.

Kaiser Family Foundation (KFF) examined the sources of Medicare funding in 2018. Medicare recipients may be surprised to learn that payroll taxes accounted for only 36% of monies spent, the Federal government’s general fund 43%, and premiums a mere 15%. The remaining revenue came from transfers from states, Social Security benefit taxes and earned interest.
Social Security
From 1970 through 2007 annual Social Security Benefits paid per capita increased by an average of 7.30%, reported inflation during the same period averaged 4.67% annually.
From 2008 through 2021 annual Social Security Benefits per capita increased by 4.32%, reported inflation during the same period averaged 1.90%.
Total Social Security Benefits are estimated to come in at 1.156 trillion in 2021 and 1.445 trillion by 2025.
Despite more money being paid into Social Security than any other time in history Social Security will stop running a surplus this year starting in 2022 the Federal Government will need to borrow or create more money to pay retiring beneficiaries rather than borrowing out the surplus which they’ve done every year since 1935.
According to the 2020 Social Security Trustees Report Social Security will be insolvent on or before 2035.
If I lived in the United States and had to make involuntary payments into a retirement account that would be insolvent by the time I retired I’d be very angry and want monetary compensation and jail-time for the decision makers that thought it was OK to embezzle funds from my retirement account to fund absurd Federal Spending.

Status of Government Trust Reserves
As of April 2021 the Federal Government had borrowed out 5.982 trillion in reserves held in trust for Government Pensions replacing these reserves with “special issue securities” these non marketable securities earn a non competitive rate with duration between 1 to 15 years
Non competitive rates with a negative rate of return ensure a guaranteed loss in buying power for every beneficiary that made mandatory payments their entire working lives into Social Security, Military or Civilian Employee Pension Trusts.

Cost to citizens
Inflation manipulation by the BLS to justify low Treasury rates and the depletion of retirement accounts has stripped American citizens of 10’s of trillions of dollars and lowered the quality of life for all, the sad part is no one is calling the Federal Government out so they continue to do it.
Poverty rate in the United States
The U.S. Census Bureau reports the 2020 poverty rate at 19.71%, 5.85% higher than the 1989-2020 average of 13.85% .
Looking closer at the U.S. poverty rate the U.S. Census Bureau also uses deceitful accounting tricks to massage the official poverty rate lower.
In 1970 if your income was below 49.60% of U.S. personal income you were below the poverty threshold, this ratio has been lowered every year since 1970.
By 2020 this percentage had been lowered to 21.69% of U.S. personal Income. The U.S. Census Bureau is telling you if your annual pretax income is $12,940 annually, $1,078 monthly you were above the poverty threshold and ineligible for many poverty related subsides.
Using the 1970 ratio of 49.60% you’d be below the poverty threshold in 2020 if your pre tax annual income was below $29,581, $2,465 monthly.
According the the Social Security administration 51% of the employed American population makes less that $30,000.
By lowering the criteria than defines the poverty threshold the U.S has contained trillions poverty related subsides.
It should come as no surprise that the official poverty rate is linked to the official BLS inflation rate.

U.S Homeless Rate
According to the Department of Housing and Urban Development (HUD) since 2005 the homeless rate in the U.S. has declined by 23.04% from 754,147 in 2005 to 580,455 in 2020.
According to the Department of Housing and Urban Development (HUD) since 2005 the homeless rate in the U.S. has declined by 23.04% from 754,147 in 2005 to 580,455 in 2020.
HUD also is telling us that the homeless rate in the United States increased by only 12,751 people in 2020.
Using tweaked poverty rate numbers it’s the poverty rate is at a 50 year high and the homeless rate declined by 23.04% since 2005 does this make sense to you?

It should be very clear why U.S. Federal debt has been downgraded twice in ten years and faces at least 1 or more in the next 4.
With the spending on deck the annual Federal Revenue to total Federal debt ratio will drop from 11.16% to less than 9.00% by 2022
Politician will raise long-term capital gains and income tax for top earners
Politicians will raise Corporate tax, hike the minimum wage raise income tax revenue, up regulations which they hope will result additional income from fines Face it it’s already bad and getting worse by the year the trade deficits tell the story
What these political dinosaurs that have ruined the country don’t realize is professional trader like myself no longer consider Treasuries and dollars quality.
The majority of these long term investors woud rather will tak thier chanes owning quality stock who’s value is based o tangible assest and profitability rather than Treasuires and dollars back by the the full faith and trust of the US government, thiose who do liquidate will by gold or any tangible asset before Treasuires.
The stock market will sell off will be far less than politicains were hoping negating the justification they were looking for to print more money.
With a current credit rating that’s the same as Finland and Hong Kong’s the U.S. can’t afford to raise rates to attract buyers for record trillions in new debt, that pay the lowest yields history with the worst debt rating in history, denominated in a currency it’s central bank creates by the trillions. What idiot would buy a 5 to 30 year Treasury bond with a negative real rate of return in 2021?
Unable to Fund record defict spending the Federal Government will instruct the Federal Reserve to create as many trillions as it takes to sustain spending.
True Dollar devalution will enage with tenacity as this occurs over 7 trillion in foreign debt will unwind.
Unable to find buyers for foreign debt that is being liquidated much less new debt to sustain spending the Federal Government will instruct the Federal Resrve to create as much money as it takes to cover foreign liquidation and sustain spending.
The annual Federal revenue to total federal debt ratio will fall to less than 5%
Corporate taxation, regulation and litigation with esculate to the point corporations will be fleeing the US for offshore locations, the percentage of the workforce that is employed in the manuafaturing sector will drop from the current 8% to less than 4%
People who make $400,000 or more will do the math, incorporate offshore throgh the same structure Epstein provided to a host of politicians and high profile clients while he entained them on little St james rather than forfeit income equivilent to 6 to 9 months of thier professional lives each year.
They fly intop the airport at the bottom of the hil of my house
They enjoy beautiful weather, clear water in a polite society
An they watch the U.S implode from 800 miles sout east ok miami political corruption and incompetence destroy whats left of America
Although most bilionares that are critial of censervative have alredy set up what epstien offered politicians and high profiel clients I don’t think they like the environment that thier agnda will create.
I see Federal Debt by the end of 2024 above XXX and the Federal Reserve owning YYYY of that debt
With the creation of XXXX trillion the cost of eveything witll rocket higher
The Federal Reserve will go from buying
he math magicians at the BLS’s wont be able to contain offical inflation without potential Federal incration
I’ve been a professional trader and run a family office for nearly 30 years, my primary objective is preservation of family wealth, secondary objective enhancement of family wealth, my performance is judged by asset valuation in gold not a fiat currency.
From 2008 though April 2021 Federal debt has increased from
11.16% is the lowest Federal revenue to debt ratio in history and makes it impossible for the U.S. to accurately report inflation, normalize interest rates or any Federal expense whose increase is pegged to reported inflation, Social Security, Medicare, Military, Civilian employee pensions and Treasury rates.
If inflation was accurately reported Treasury rates would normalize to the 1970 – 2007 average of 8.70% at 8.70% debt service cost would consume 68% of all Federal revenue.