Time to control risk on long positions and brush up on shorting strategies.


The S&P 500 index is the most widely followed benchmark for US equity markets, if not equities globally. Traders know the most popular companies in it as well – Apple, Exxon Mobil, Microsoft, Johnson & Johnson, General Electric, Wells Fargo and so on. The S&P 500 index is the one used by most large hedge funds and asset managers to benchmark their funds and use it as the barometer of how well they are doing, not to mention the health of the US economy.

One way traders can access the S&P 500 index for speculative hedging opportunities, is through the E-mini S&P 500 futures or options. This product is far more capital efficient than a corresponding ETF product or even a basket of stocks. If you understand the broad market, what is pushing and pulling on it on a daily, weekly and monthly basis, then the E-mini S&P provides a manageable-sized product that offers traders the ability to trade the market up or down.

What we’re trading 


Currency ATA Performance 2007-2017

20 Year Charts   EUR       GBP      JPY       AUD      CAD

1) Performance dates 8 January 2007 through 31 December 2017

Recommended Starting Balance $100,000.00
Cumulative Net Profit
$855,674.06
Maximum Drawdown (25.07%)
($25,068.18)
Best Year 2008 +172.99% $172,992.93
Worst Year 2007 +16.56% $16,555.80
2007-2017 Average +77.79% $77,788.55
2017 +48.68%
$48,677.50

1.1) Performance

1.2) Monthly and Annual Performance 

Disclosure

2) Automated Trading Accounts (ATA’s) what they are and how they work

2.1) As our ATA Client you maintain control of

  • The market(s) you trade and when
  • The methodologies you trade
  • The level of leverage that suits your risk tolerance
  • The overall risk for your account

2.2) ATA Team responsibilities include

  • Calculating entries, risk levels and profit objectives
  • Placing all orders and diligently overseeing executions, positions and balance
  • Monitoring total account risk to ensure it is within your defined guidelines
  • Ensuring everything is done correctly and assuming liability if it’s not
  • Answering all your questions on markets and methodologies

2.3) About this ATA

  • This ATA uses fully disclosed trading methodology
  • Trades with the trend long or short
  • Uses option collars that define risk on every trade and duration of every trading period
  • Trades in this ATA cannot be stopped out regardless of market volatility
  • The only way a position can be called away is at a profit
  • If the market stays the same this ATA hasn’t wasted precious investment capital on purchasing option time premium as it’s collecting approximately as much  time premium on the covered writes at the profit objectives, as it’s paying out on the purchased options that define maximum trade risk
  • Option collars can be offset at any time locking in gains and/or modified to capture more of the move or, reversed to capture a trend reversal.
  • Mark-to-market positions and balance are available online at any time
  • Statements are emailed daily disclosing positions, liquidating value and any trading activity
  • Monthly statements summarize all activity and end of month balance
  • Liquidity for ATA accounts in portion or all is 2 to 48 hours in any major currency
  • AIM ATA’s afford you the opportunity to modify markets, units you trade and your overall account risk level at any time
  • Currency Quotes and essentials for trading
  • Additional Currency guides, reports and videos
  • Other markets we trade ATA’s on in North America and Europe
  • Contact us with your questions
  • Schedule an online review

3) Disclosure of Trading Methodology 

  • Open the EUR Collar Spreadsheet
  • Set to open with Excel
  • Click OK
  • Enable editing
  • Enable content
  • Play the instructional video embedded in the top center of spreadsheet (some browsers and/or versions of excel do not allow this, if you have difficulties the spreadsheet instructions start at 9:35 in the video above)

3.1) Spreadsheet and instructions to track, duplicate trades, or generate your own.

3.1) Spreadsheet and instructions to track, duplicate trades, or generate your own.

  • Open the EUR Collar Spreadsheet
  • Set to open with Excel
  • Click OK
  • Enable editing
  • Enable content
  • Play the instructional video embedded in the top center of spreadsheet (some browsers and/or versions of excel do not allow this, if you have difficulties the spreadsheet instructions start at 9:35 in the video above)

4.1) Eurodollar

4.2) British Pound

4.3) Japanese Yen

4) Australian Dollar

4.5) Canadian Dollar daily

5) Defining risk for your Automated Trading Account

  • Allows you to set a stop loss for your account based on the liquidation value of the account ( maintenance balance)
  • Should the account fall below your defined maintenance balance as of the settlement on any trading day our team will automatically liquidate all positions on or before the next settlement and report back to you.
  • If we fail to liquidate on or before the next settlement we would liable for any losses from that settlement forward
  • Trading Authorization for the program is automatically revoked
  • Any new positions would be deemed unauthorized and transferred to the Asset Investment Management (AIM) error account immediately.

6) How incentive fees work (3 minutes 45 seconds)

  • AIM Advisory & Risk Control Agreement
  • 0.00% Front load
  • 0.00% Management fee
  • 12.50% Of net new high profits quarterly
  • Net new highs (calculated after all brokerage, exchange and regulatory fees have been deducted including those on open positions)
  • Quarterly incentive fees have to be approved by the client prior to be deducted from the account

7) How to open an account

If you have questions send us a message or  schedule an online review  to speak with a broker who’ll  answer your questions and provide supporting links for additional information and/or verification.


Disclosure

Opinion    20 Year Chart    5 Year Chart    1 Year Chart

1) Performance dates 8 January 2007 through 31 December 2017

Recommended Starting Balance $25,000.00
Cumulative Net Profit
$310,008.00
Maximum Drawdown
($12,457.00)
Best  Year 2015   +225.15% $56,287.50
Worst Year 2012  +3.60% $900.00
2007-2017 Average   +112.73% $28,182.55
2017   +146.48% $36,620.50

1.1) Performance 

1.2) Monthly and Annual Performance

Disclosure

2) Automated Trading Accounts, what they are and how they work 

2.1) As our ATA Client you maintain control of

  • The market(s) you trade and when
  • The methodologies you trade
  • The level of leverage that suits your risk tolerance
  • The overall risk for your account

2.2) ATA Team responsibilities include 

  • Calculating entries, risk levels and profit objectives
  • Placing all orders and diligently overseeing executions, positions and balance
  • Monitoring total account risk to ensure it is within your defined guidelines
  • Ensuring everything is done correctly and assuming liability if it’s not
  • Answering all your questions on markets and methodologies

2.3) About this ATA

  • This ATA uses fully disclosed trading methodology
  • Trades with the trend long or short
  • Uses option collars that define risk on every trade and duration of every trading period
  • Trades in this ATA cannot be stopped out regardless of market volatility
  • The only way a position can be called away is at a profit
  • If the market stays the same this ATA hasn’t wasted precious investment capital on purchasing option time premium as it’s collecting approximately as much  time premium on the covered writes at the profit objectives, as it’s paying out on the purchased options that define maximum trade risk
  • Option collars can be offset at any time locking in gains and/or modified to capture more of the move or, reversed to capture a trend reversal.
  • Mark-to-market positions and balance are available online at any time
  • Statements are emailed daily disclosing positions, liquidating value and any trading activity
  • Monthly statements summarize all activity and end of month balance
  • Liquidity for ATA accounts in portion or all is 2 to 48 hours in any major currency
  • AIM ATA’s afford you the opportunity to modify markets, units you trade and your overall account risk level at any time
  • S&P 500 contract information, charts and quotes
  • Additional S&P guides, reports and videos
  • Other markets we trade ATA’s on in North America and Europe
  • Contact us with your questions
  • Schedule an online review

3) Disclosure of Trading Methodology
Section 3 will be updated by 15 December 2017

3.1) The S&P 500 T221 trades up to 5 trend following programs using “option collars” that define risk on every trade and for the duration of every trading period.

  • 2 short-term, trade duration 5 to 21 days
  • 2 medium-term, trade duration 22-45 days
  • 1 long-term, trade duration 46 to 90 days
  • Total margin requirements for this ATA is less than $12,500 USD or major currency equivalent per trading unit as all positions are fully hedged.

3.2) Skip “Disclosure of Trading Methodology and Current Fundamentals” and go directly to the risk/reward spreadsheet and instructions.

  • S&P 500 Collar Spreadsheet
  • Open with Excel
  • Click OK
  • Enable editing
  • Enable content
  • Play the instructional video embedded into right side of the spreadsheet

4) S&P 500 Spreadsheet Instructional Video & Trading Tools
Section 4 will be updated by 15 December 2017

4.1) S&P 500 Collar Spreadsheet
4.2) S&P contract specifications and information
4.3) Opinion
4.4) 1 Year chart using daily price data
4.5) 5 Year chart using weekly price data
4.6) 20 Year chart using monthly price data
4.7) Analysis 1
4.8) Analysis 2
4.9) Ranges
4.10) CME Futures Quotes
4.11) CME Options Quotes
4.12) Barchart Options Quotes

5) Defining overall risk for your Automated Trading Account

  • Should the account fall below your defined maintenance balance as of the settlement on any trading day our team will automatically liquidate all positions on or before the next settlement and report back to you.
  • If we fail to liquidate on or before the next settlement we would liable for any losses from that settlement forward
  • Trading Authorization is automatically revoked
  • Any new positions would be deemed unauthorized and transferred to the Asset Investment Management (AIM) error account immediately.

6) How Automated Trading Account incentive fees work

  • AIM Advisory & Risk Control Agreement
  • 0.00%  Front load
  • 0.00%  Management fee
  • 12.50% Of net new high profits quarterly
  • Net new highs (calculated after all brokerage, exchange and regulatory fees have been deducted including those on open positions)
  • Quarterly incentive fees have to be approved by the client prior to be deducted from the account

7) How to open an account

If you have questions send us a message or  schedule an online review  to speak with a broker who’ll  answer your questions and provide supporting links for additional information and/or verification.


Disclosure


Gold ATA Performance 2005-2017

 Opinion    20 Year Chart    5 Year Chart    Daily Chart 

1) Performance March 2005 through December 2017

Recommended Starting Balance $25,000.00
Cumulative Net Profit
$333,710.94
Maximum Drawdown (49.10%)
($12,276.00)
Best Year 2008 +237.96% $59,490.00
Worst Year 2007 +16.75% $4,187.00
2005-2017 Average +104.01% $26,003.45
2017 +151.12%
$37,781.00

1.1) Performance

1.2) Monthly and Annual Performance 

Disclosure

2) Automated Trading Accounts (ATA’s) what they are and how they work  (3 minutes 39 seconds)

2.1) As our ATA Client you maintain control of

  • The market(s) you trade and when
  • The methodologies you trade
  • The level of leverage that suits your risk tolerance
  • The overall risk for your account

2.2) ATA Team responsibilities include

  • Calculating entries, trade risk levels and profit objectives
  • Placing all orders and diligently overseeing executions, positions and balance
  • Monitoring total account risk to ensure it is within your defined guidelines
  • Ensuring everything is done correctly and assuming liability if it’s not
  • Answering all your questions on markets and methodologies

2.3) About this ATA

  • This ATA uses fully disclosed trading methodology
  • Trades with the trend long or short
  • Uses option collars that define risk on every trade and duration of every trading period
  • Trades in this ATA cannot be stopped out regardless of market volatility
  • The only way a position can be called away is at a profit
  • If the market stays the same this ATA hasn’t wasted precious investment capital on purchasing option time premium as it is collecting approximately as much  time premium on the covered writes (at the profit objectives), as it’s paying out on the purchased options that define maximum trade risk
  • Option collars can be offset at any time locking in gains and/or modified to capture more of the move or, reversed to capture a trend reversal
  • Mark-to-market positions and balance are available online at any time
  • Statements are emailed daily disclosing positions, liquidating value and any trading activity
  • Monthly statements summarize all activity and end of month balance
  • Liquidity for ATA accounts in portion or all is 2 to 48 hours in any major currency
  • AIM ATA’s afford you the opportunity to modify markets, units you trade and your overall account risk level at any time
  • Gold Quotes and essentials for trading
  • Additional Gold guides, reports and videos
  • Other markets we trade ATA’s on in North America and Europe
  • Contact us with your questions
  • Schedule an online review

3) Disclosure of Trading Methodology (25 minutes 4 seconds) (automated software is available to qualified clients)

3.1) Spreadsheet and instructions to track, duplicate trades, or generate your own.

  • Gold Collar Spreadsheet
  • Set to open with Excel
  • Click OK
  • Enable editing
  • Enable content
  • Play the instructional video embedded in the top center of spreadsheet (some browsers and/or versions of excel do not allow this, if you have difficulties the spreadsheet instructions start at 9:35 in the video above)

4) Gold Trading Tools

4.1)  Gold Collar Spreadsheet
4.2) Gold contract specifications and information
4.3) Opinion
4.4) 1 Year chart using daily price data
4.5) 5 Year chart using weekly price data
4.6) 20 Year chart using monthly price data
4.7) Analysis 1
4.8) Analysis 2
4.9) Ranges
4.10) CME Futures Quotes
4.11) CME Options Quotes
4.12) Barchart Options Quotes

5) Defining risk for your Automated Trading Account (ATA)
(5 minutes 4 seconds)

5.1) AIM Advisory & Risk Control Agreement
5.2) Risk Control Agreement

  • Allows you to set a stop loss for your account based on the liquidation value of the account ( maintenance balance)
  • Should the account fall below your defined maintenance balance as of the settlement on any trading day our team will automatically liquidate all positions on or before the next settlement and report back to you.
  • If we fail to liquidate on or before the next settlement we would liable for any losses from that settlement forward
  • Trading Authorization for the program is automatically revoked
  • Any new positions would be deemed unauthorized and transferred to the Asset Investment Management (AIM) error account immediately.

6) How incentive fees work (3 minutes 45 seconds)

  • AIM Advisory & Risk Control Agreement
  • 0.00% Front load
  • 0.00% Management fee
  • 12.50% Of net new high profits quarterly
  • Net new highs (calculated after all brokerage, exchange and regulatory fees have been deducted including those on open positions)
  • Quarterly incentive fees have to be approved by the client prior to be deducted from the account

7) How to open an account

If you have questions send us a message or  schedule an online review  to speak with a broker who’ll  answer your questions and provide supporting links for additional information and/or verification.


Disclosure

2007-2017 ATA Performance

 6,700+ Trading Programs   500+ Markets    43 Exchanges 

Top Performing ATA’s 2007-2017

Gold S&P 500 Currency
Period Return Period Return Period Return
2007 16.75% 2007 45.05% 2007 16.56%
2008 237.96% 2008 165.10% 2008 172.99%
2009 80.40% 2009 156.65% 2009 162.57%
2010 78.96% 2010 16.70% 2010 77.52%
2011 164.53% 2011 106.00% 2011 111.11%
2012 193.70% 2012 3.60% 2012 66.61%
2013 141.92% 2013 91.90% 2013 71.81%
2014 34.00% 2014 158.40% 2014 23.24%
2015 55.56% 2015 225.15% 2015 43.87%
2016 74.57% 2016 125.00% 2016 60.71%
2017 131.30% 2017 113.83% 2017 51.38%


Top Performing Stocks

Top Hedge Funds

Top Commodity Trading Advisors

Additional Information

 Regards,
Peter Knight Advisor
Contact

Disclosure

Trading U.S. Short Term Rates Higher

Update for current Fed expectations for rates and when 21st of March 2018

If I am correct this trade will appreciate from 0.5500, (value $5,500) to 1.2500 (value $12,500) +$7,000, +127.27% by June 2018.

Charts to track this trade (our entry 0.5500, position value $5,500.00)

Intraday (10 minute price bars)
4 Year chart (daily data)
Each 0.01 change in price
= $100.00

If the Fed is correct about the rate they set we’ll move from 0.5500 (value $5,500) to 1.7500 (value $17,500) +12,000, +218.18% (Fed’s website & all statements)

1) How to track this trade

1) Trade entry 28 November 2017 at 0.5500, position value = $5,500
1.2) I’m expecting the price to increase between now and June 2018
1.3) Position value to increase from 0.5500 ($5,500) to 1.2500 ($12,500)
1.4) Click here for the current  chart/price (no password required)
1.5) Each 0.01 change in price = $100.00
1.6) Contracts we’re trading  Long 4 GEM18 – Short 4 GEM22

2) Click here to enlarge the 5 year position valuation chart below

3) Fundamentals

3.1) Fed currently says 7, 0.25% rate hikes by December 2020
3.2) Market is pricing in 2, 0.25% hikes between June 2018 and June 2022
3.3) I believe we’ll see 5, 0.25% hikes priced in for June 2022 by June 2018
3.4) All Fed Policy meetings press conferences, videos and statements

4) Fed’s estimates of where rates will be and when. 

4.1) 1.40% December 2017 (0.25% in rate hikes)
4.2) 2.10% December 2018 (0.95% in rate hikes)
4.3) 2.70% December 2019 (1.55% in rate hikes)
4.4) 2.90% December 2020 ( 1.75% in rate hikes)

5) Resources

5.1) What were trading to capture this move
5.2) Contract Specifications 
5.3) Additional markets and strategies for trading rates higher
5.4) Educational videos
5.5) About us
5.6) Open an account

Send us a message or  schedule an online review  to speak with a broker who’ll  answer your questions and provide supporting links for additional information and/or verification.

Regards,
Peter Knight Advisor

Disclosure

Trading The Platinum-Gold Spread

Platinum versus Gold     Gold quotes & chart     Platinum quotes & chart

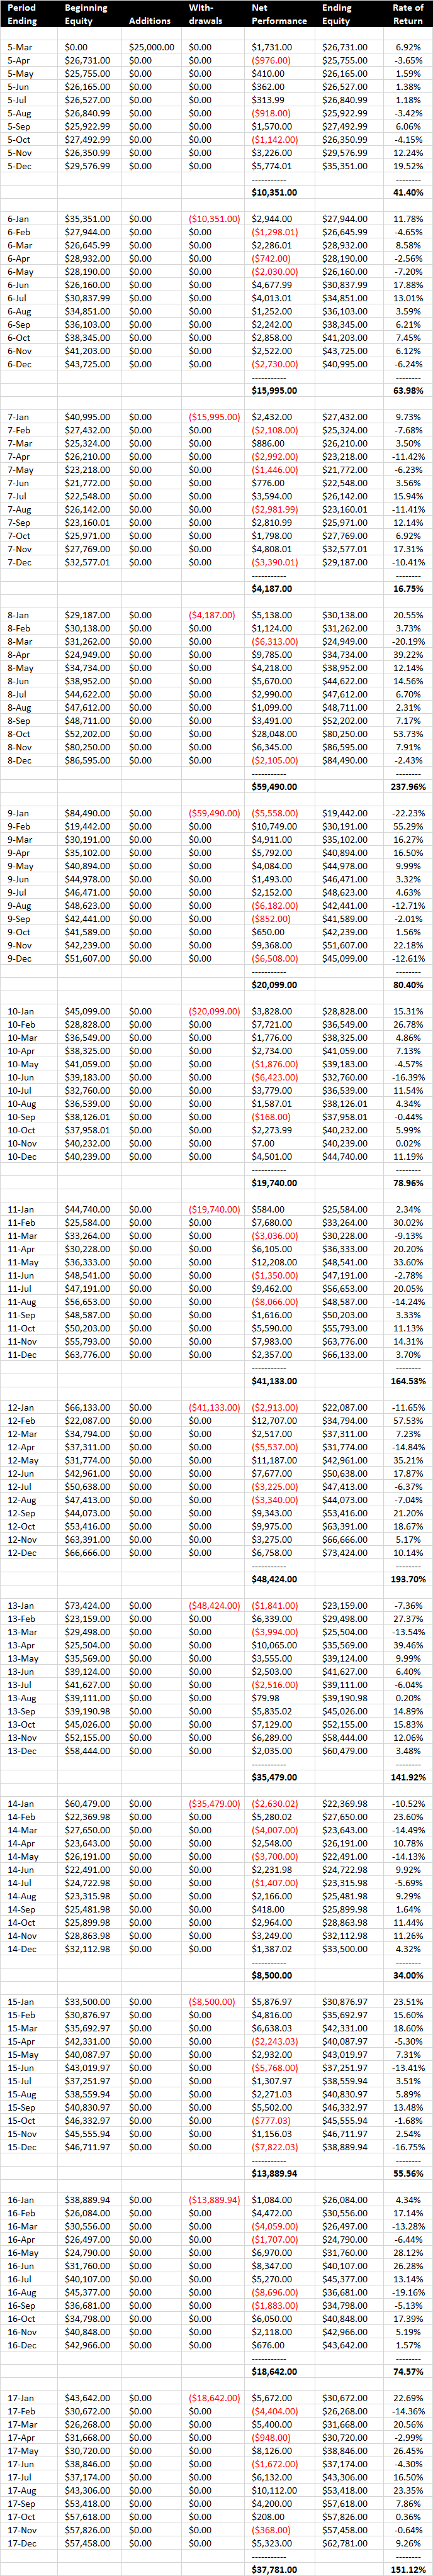
This strategy has captured the majority of the major market moves in the Platinum-Gold spread since 1977. This report enables you to generate trades and watch them work. Recommended minimum for this strategy $25,000 or major currency equivalent.

Sections

1) 20 year historical price correlation between Platinum & Gold
2) Contracts we’re trading to capture the moves up or down
4) We Trade the contact months with the highest volume
5)  If you believe Gold will continue to gain on Platinum
6) If you believe Platinum will gain on gold
7) The simple and effective way to determine the direction of this spread
8) How to track the trades generated
9) Send us a message or schedule and online review
10) Resources

1) Platinum versus Gold  using monthly price data last 20 years.

2) Contracts we’re trading

2.1) Platinum futures are traded in 50 troy ounce contracts
2.2) Gold Futures 100 troy ounce contacts

3) We trade the contact delivery month with the highest volume

3.1) Platinum Quotes & Volume
3.2) Gold Futures Quotes and Volume

4) If you believe Gold will gain on Platinum

  • Buy 1 Gold futures contact GC (long 100 troy ounces)
  • Sell 2 Platinum futures contracts PL (short 100 troy ounces)

5) If you believe Platinum will gain on gold

  • Sell 1 Gold futures contract GC (short 100 troy ounces)
  • Buy 2 Platinum Futures contract PL (long 100 troy ounces)

6) The simple way we determine direction of this spread is using a Moving Average Exponential (9).

6.1) If price action is above the red line buy 2 Platinum, sell 1 Gold contract
6.2) Below the red line Sell 2 Platinum, Buy 1 Gold contract
6.3) Each $1.00 change in the spread’s price = $100
6.4) Allow $0.75 to cover all bid/ask spreads and brokerage fees ($75)
6.5) Put up $25,000 per position to avoid margin issues

7)  Use this chart to determine direction,  if price action is above the red line buy Platinum, sell Gold, below the red line sell Platinum buy Gold.

8) Use this 15-minute chart to monitor the profit or loss, each $1.00 change in the spread price equals $100.00.

Screenshot_16

9) Send us a message or  schedule an online review  to speak with a broker who’ll  answer your questions and provide supporting links for additional information and/or verification

10) Resources

10.1) Exchange information on the Platinum/Gold spread
10.2) Educational videos
10.3) About us
10.4) Open an account

Current extreme fundamentals are very likely to continue generating major market moves for this spread, I’m looking forward to an exciting year capturing them.

Regards,
Peter Knight Advisor

Disclosure


Exchanges Traded & Links to their Websites

Exchange & Website Links Location
ASX  (Australian Stock Exchange) Australia
BATS Options USA
BM&FBOVESPA Brazil
BME (Madrid Stock Exchange) Spain
BOX (Boston Options Exchange) USA
CBOE (Chicago Board Options Exchange) USA
CBOT (Chicago Board of Trade) USA
CME (Chicago Mercantile Exchange) USA
CSE (OMX Copenhagen) Denmark
DCE  (Dalian Commodity Exchange) China
DGCX (Dubai Commodity Exchange) Dubai
DME (Dubai Mercantile Exchange) Dubai
EURONEXT Amsterdam The Netherlands
EURONEXT Brussels Belgium
EURONEXT Lisbon Portugal
EURONEXT Paris France
FSE (Frankfurt Stock Exchange) Germany
HKEx (Hong Kong Exchanges) Hong Kong
HSE (OMX Helsinki) Finland
ISE (International Securities Exchange) USA
JSE  (Johannesburg Stock Exchange) South Africa
LSE (London Stock Exchange) UK
MEX (Mexican Stock Exchange) Mexico
MIL (Milan Stock Exchange) Italy
MOEX (Moscow Exchange) Russia
NSE (National Stock Exchange of India) India
NASDAQ Options Market USA
NASDAQ USA
NYMEX (New York Mercantile Exchange) USA
NYSE (New York Stock Exchange) USA
NYSE ARCA USA
NYSE AMEX USA
NYSE (Ice) USA
NYSE MKT USA
OSE (Oslo Stock Exchange) Norway
SHFE Shanghai Futures Exchange  Shanghai
SGX (Singapoer Exchange) Singapore
TSE (Tokyo Stock Exchange) Japan
TSE (Toronto Stock Exchange) Canada
TSX (Toronto Venture Exchange) Canada
UE (Ukrainian Exchange) Ukraine
VIE (Vienna Stock Exchange) Austria
ZCE (Zhengzhou Commodity Exchange) China

If you have any questions send a message or contact me.

Regards,
Peter Knight Advisor

Privacy Notice

Disclosure