Send us a message or schedule an online review to speak with a broker who’ll answer questions and provide supporting links for additional information and/or verification.
For beginners see this trade, for more advanced traders see the links below.
1) Tracking these trades and/or experimenting with any potential outcome for them.
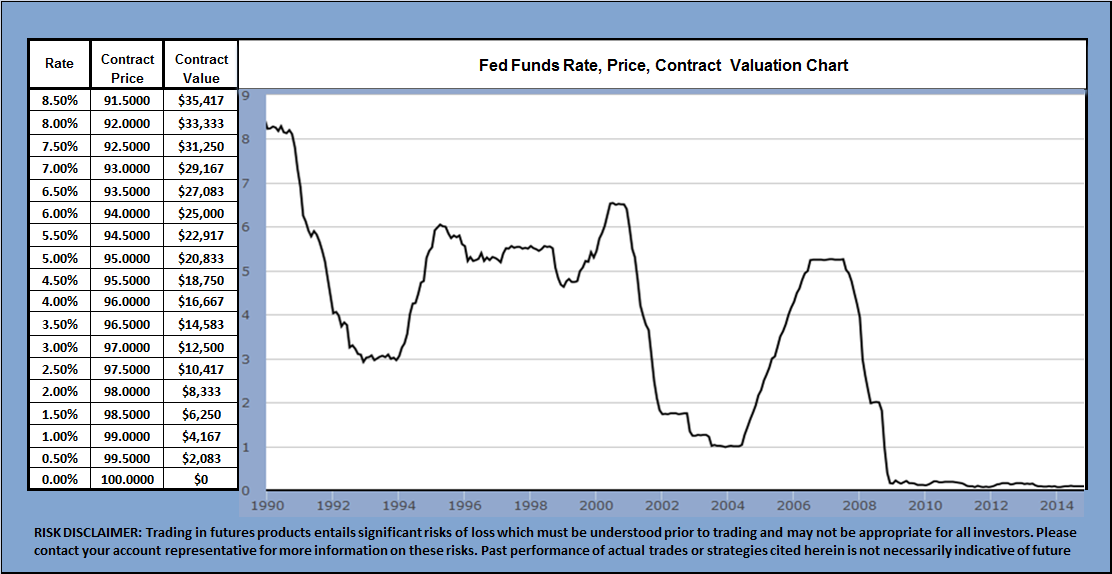
100.0000 Represents a rate of 0.0000% (100.0000 – price = rate) -99.1650 Subtract the contract entry price 0.8350% = Markets anticipated rate for Dec. 2018 delivery at entry
100.0000 Represents a rate of 0.0000% (100.0000 – price = rate) -97.9000 Price at the lowest anticipated rate by the Fed by Dec 2018 2.1000% = Thelowest anticipated rate by the Fed for December 2018 delivery
We’re short, positioned to capture the move lower in the ZQZ18’s contract price from 99.1650 to 97.9000. This represents an increase in the Fed Funds rate from 0.8350% to 2.1000%, the the lowest of the Federal Reserve’s expectations for this rate by the end of December 2018.
5) Lowest of Fed expectations for rate hikes through 2019. (June 2017)
6) Median Fed expectations for rate hikes through 2019 (December 2014) however the Fed has been wrong on nearly every economic forecast and literally every rate call since 2008. The standard joke is the Fed no longer stands for Federal Reserve but failed economic policy.
9) Open an accountfor minimums of 10K to 500K USD or major currency equivalent, for account greater than 500K you can work with the majority of the firms listed on this page.
If you’d like to review this and/or other programs/markets please contact us or schedule an online review using this link, we’ll answer all your questions and provide you supporting links for additional information and/or verification.
Expect a maximum of 3, 0.25% rate hikes by December 2018
Rates will not “normalize” this decade
True economic recovery will take far longer than than the most pessimistic of Fed guesstimates.
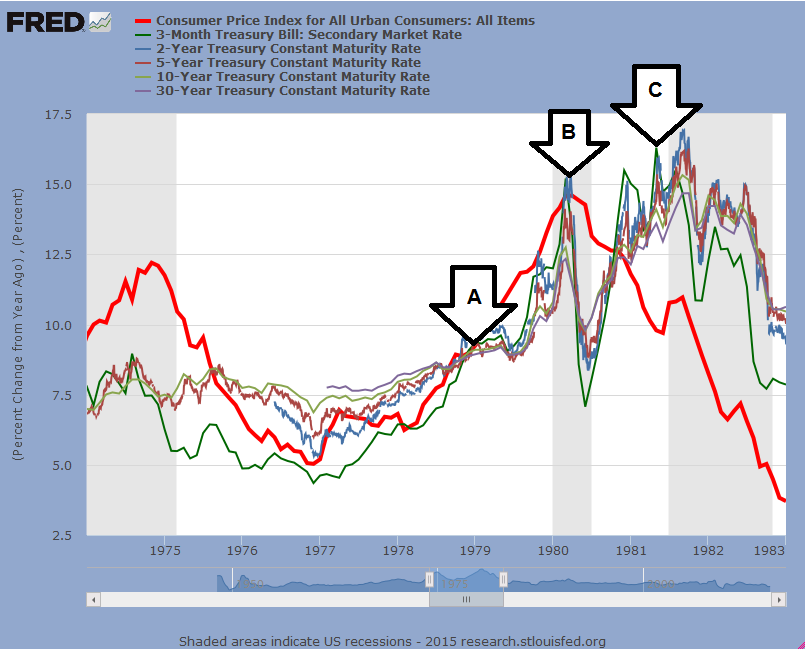
A-C on the chart below shows the markets expectations for rate hikes
A) In January 2013 the market was pricing in 6 , 0.25% rate hikes by December 2018, with the spread between the June 2016 (GEM16) and December 2018 (GEZ18) deliveries at 1.50, position value 3,750.00 USD
B) By November 2013, optimism for US economic recovery and rate normalization peaked with the market pricing in 10, 0.25% rate hikes with the spread at 2.50, position value 6,750.00 USD
C) Current rate hike expectations have dropped to less than 3, 0.25% hikes, with the spread at 0.6250, position value 1,562.50 USD
D) If the market had faith in the Fed’s projections the spread between the June 2016 (GEM16) and December 2018 (GEZ18) deliveries would be 2.50 reflecting the Fed’s expected 10, 0.25% hikes, position value 6,250 USD.
To convert the contact delivery price into rate it represents take 100.00 – contract price = the rate.
Example, 100.00 – the December 2016 contract price of 99.17 = an expected rate of 0.83%.
To calculate expected rate increases between delivery months take the nearby delivery minus the forward delivery equals the expected rate change between the delivery months.
Example, June 2016 delivery trading at 99.3350 – December 2016 at 99.1700 = the expected increase in rates from June 2016 to December 2016 = 0.1650%.
What U.S. price action tell us.
The market’s perception of economic recovery is far worse than the Fed’s.
Rates will not “normalize” during this decade.
Fed and US fiscal policy makers creditability with the market is at a low
Eurozone market expectations are worse.
A) In January 2013 the Eurozone expected an increase in the 3 month Euro Interbank Offered Rate (EuriBor) between June 2016 (IMM16) and December 2018 (IMZ18) of 0.6000%, position value 1,500.00 EUR
B) By November 2013 optimism for Eurozone economic recovery and rate normalization peaked with an expected increase in the EuriBor rate between June 2016 (IMM16) and December 2018 (IMZ18) of 1.10%, position value 2,750.00 EUR
C) Currently optimism for Eurozone economic recovery and rate normalization has hit a low with an expected increase in the EuriBor rate between June 2016 (IMM16) and December 2018 (IMZ18) at 0.10%, position value 250 EUR.
Converting the contact price into rate increase/decrease and between delivery months works the same as the US.
Use the quotes on this Exchange pageto calculate today’s Eurozone rate expectations through March 2022
3 Month EuriBor price action tells us
The EuriBor rate is expected to move 0.0350% lower during 2016
The market sees only a 0.0700% rate increase between now and December 2018
The EuriBor rate will remain negative through December 2019
Eurozone rates will not “normalize” this decade
United Kingdom, nearly the same
A) In January 2013 the UK market action expected an increase in UK 3 month rates between June 2016 (LZ16) and December 2018 (LZ18) of 1.20%, position value 3,000.00 GBP.
B) By January 2014 optimism peaked with the market at 1.60%, position value 4,125.00 GBP.
C) Currently UK market action says a 0.30% increase, position value 750.00 GBP.
Using the quotes on this exchange pageconversions and expected increase/decrease work the same as the U.S. and Eurozone.
What the Global Stock markets telling us about “economic recovery”
Let’s skip all the subjective fundamental economic over analysis and look at the big picture price action. Price action is telling us uncertainty and doubt about economic recovery has now spread into the global equity markets.
On the 16 year S&P chart below note the current volatility relative to the overall rate of change, The monthly moving average (green) has been violated, the majority of the price action is now below the moving average.
Does this market look like it’s in a healthy up trend to you?
Increased volatility relative to the overall rate of change, the DAX has broken below the monthly moving average (green), the majority of the price action is now below the moving average and the long term trend appears to be changing from up to down.
Increased volatility, the market has broken below the monthly moving average (green), the majority of price action now remains below the moving average, the long term trend appears to be shifting from up to down.
Put opinions aside, trade with the trend, long or short
Learn new markets and strategies.
Trade whatever market/sector has the highest return on risk
Define your risk on your trades and for the duration of the trading period without wasting precious investment capital on option time premium to hedge risk.
One example of defined risk trade using the Euro Stoxx 50traded at EUREX
Looking at the chart below is it really that hard to identify the current daily trend using the moving average (green) ? We’ve seen the break below the daily moving average with the majority of current price action now below the average.
Eurozone rate expectations sum up the economic fundamentals. The EuriBor is pricing in lower rates during 2016 moving from the current negative 0.2550% to negative 0.2900% by December 2016. EuriBor traders are telling us loud and clear true economic recovery isn’t expected for the Eurozone in 2016.
Structuring a defined risk trade shorting theEuro Stoxx 50
A) Short the Euro Stoxx 50 at 3,000, position value 30,000 EUR B) Write the 2,800 put collecting premium C) Using the collected premium purchase the 3,200 call to hedge the short position
Risk is defined on the trade and for the duration of the trading period
This trade cannot be stopped out regardless of market volatility, the only thing needed to be profitable is anticipating the market’s overall direction correctly.
The trade can be liquidated at any time , you do not need to hold the position to expiration.
The only way the 3,000 short can be pulled away is at a 2,800 generating a gross profit of 2,000 EUR.
If the market reverses and rallies to 3,800 losses above 3,200 are hedged by the 3,200 call with losses limited to 2,000 EUR.
If the market stays the same and you’ve structured your trade correctly you should break even as you’ve collected as much time premium on the 2,800 put write against your 3,000 short as you’ve paid out for the 3,200 call to hedge.
Effective “option collar” strategies are not limited to the international futures markets they can be employed in any market that has underlying option liquidity.
Examples
Baxter International Inc (BAX) – NYSE, Bank of America Corporation (BAC) – NYSE, General Electric Company (GE) – NYSE, SPDR S&P 500 Trust ETF (SPY) – NYSEARCA, iShares MSCI Emerging Markets ETF (EEM) – NYSEARCA, SPDR S&P Metals and Mining ETF (XME) – NYSEARCA, Pfizer Inc. (PFE) – NYSE, Apple Inc. (AAPL) – NASDAQ, SPDR Gold Trust ETF (GLD) – NYSEARCA, iPath S&P 500 VIX Short-Term Futures ETN (VXX) – NYSEARCA, Market Vectors Gold Miners ETF (GDX) – NYSEARCA, Ford Motor Company (F) – NYSE, Financial Select Sector SPDR ETF (XLF) – NYSEARCA, iShares China Large-Cap ETF (FXI) – NYSEARCA, Shares Russell 2000 ETF (IWM) – NYSEARCA,
Let’s take a look how a “collared” position protected me in AppleAAPL
I’m sure I wasn’t the only one caught long Apple AAPLat 130 USD in July 2015
I made the mistake of getting too attached to being long this stock from 75.00 USD and stayed long in July 2015 at 130.00 USD despite the daily trend telling me it was questionable.
The weekly trend was telling me I was wrong
The monthly still appeared up with only a few “bumps” against the moving average and no sustained price action below the average.
The technical indicators continued to deteriorate
Rather than reverse to short or liquidate my Apple position I maintained my long hedging it up with a collar shown A-C on the chart below.
A) At the time I put down the collar AAPL was at 129.62 USD B) I wrote the 140.00 1 month call against my long C) Using the collected premium I purchased the 120.00 put
Price action got ugly quick and the market broke hard eventually taking out 110.00 USD which was disappointing but tolerable as I had my 120.00 put hedge in place negating any losses below 120.00.
I delivered my longs at 120.00, had I not “collared” this position it could have been far worse, AAPL eventually violated 95.00 USD on that run lower and has not seen a sustained move above 120.00 since.
This Apple trade was yet another refresher course for me not getting too “attached” to a stock, to pay attention to price action and not fight market momentum.
If you’re attached to your long shares or index positions (as I was too apple) you too might want to take a good hard look at the current price action and start “collaring up” positions to prevent a financial character builder.
I don’t think anyone knows for sure where the peak will be for the S&P 500 and Global equity markets.
What we do know for sure is when the S&P 500 and Global equities break the financial impact can be worse than a divorce and five kids in private school.
Using “collars” to control risk on my short to intermediate directional trades has cut my stress level on these trades by 70%.
Additional information
3 month rates or Eurodollar depositsare time deposits denominated in U.S. dollars at banks outside the United States. (There is no connection with the euro currency ). The term was originally coined for U.S. dollars deposited in European banks, but it’s expanded over the years to its present definition-a U.S. dollar-denominated deposit in any non US bank for example Tokyo or Beijing would be deemed a Eurodollar deposit. Futures open interest (contracts outstanding exceeds 10 trillion,
Euriboris short for Euro Interbank Offered Rate. The Euribor rates are based on the average interest rates at which a large panel of European banks borrow funds from one another. The Euribor rate is considered to be the most important reference rates in the European money market. The interest rates do provide the basis for the price and interest rates of all kinds of financial products like interest rate swaps, interest rate futures, saving accounts and mortgages.
Short Sterling prices are based on the British Bankers Association London Interbank Offered Rate (LIBOR) for three month sterling deposits in units of 500,000.00 GBP. 3-Month Sterling Futuresare traded on the London International Financial Futures and Options Exchange, part of NYSE Euronext. Each contract is for Interest rate on three month deposit of £500,000 of 3-month Sterling.
The Standard & Poor’s 500, often abbreviated as the S&P 500, or just “the S&P”, is an American stock market index based on the market capitalizations of 500 large companies having common stock listed on the NYSE or NASDAQ. The S&P 500 index components and their weightings are determined by S&P Dow Jones Indices. It differs from other U.S. stock market indices, such as the Dow Jones Industrial Average or the Nasdaq Composite index, because of its diverse constituency and weighting methodology. The “Composite Index”,as the S&P 500 was first called when it introduced its first stock index in 1923, began tracking a small number of stocks. 3 years later in 1926, the Composite Index expanded to 90 stocks and then in 1957 it expanded to its current 500. S&P 500 futures trading began in 1988, e-mini contract 1997.
The DAX (Deutscher Aktienindex (German stock index)) is a blue chip stock market index consisting of the 30 major German companies trading on the Frankfurt Stock Exchange. Prices are taken from the Xetra trading venue. According to Deutsche Börse, the operator of Xetra, DAX measures the performance of the Prime Standard’s 30 largest German companies in terms of order book volume and market capitalization It is the equivalent of the FT 30 and the Dow Jones Industrial Average.
The Nikkei 225, the Nikkei Stock Average is a stock market index for the Tokyo Stock Exchange (TSE). It has been calculated daily by the Nihon Keizai Shimbun (Nikkei) newspaper since 1950. It is a price-weighted index (the unit is yen), and the components are reviewed once a year. Currently, the Nikkei is the most widely quoted average of Japanese equities, similar to the Dow Jones Industrial Average. The Nikkei 225 Futures, introduced at Singapore Exchange (SGX) in 1986, the Osaka Securities Exchange (OSE) in 1988, Chicago Mercantile Exchange (CME) in 1990, is now an internationally recognized futures index.
The EURO STOXX 50 is a stock index future of Eurozone stocks designed by STOXX, an index provider owned by Deutsche Börse Group and SIX Group. Its goal is “to provide a blue-chip representation of Supersector leaders in the Eurozone”. It is made up of fifty of the largest and most liquid stocks. The index futures and options on the EURO STOXX 50, traded on Eurex, are among the most liquid futures contracts in the world
Trading the Fed Funds rate higher requires establishing a short position in theunderlying futures contract. As the rate rises the contract price falls to reflect the increase in rate.
To convert the contract price into the rate it represents
Take 100.00 – the contract price = the rate
Example 100.00 – a contract price of 99.46 = a rate of 0.54%
Each 0.01 change in price = $41.67
Contract value at 0.54% = $2,250
4) One easy trade to follow
Trade
Short the CME December 2016 Fed Funds futures contract (ZQZ16)
Price = 99.46
Contract value = $2,250
Rate = 0.54%
Objective
The Fed’s target by 31 December 2016
Objective price = 98.20
Rate = 1.80%
Contract value = $7,500
8) To experiment with any potential outcome for this trade.
9) Click hereand open the interactive risk reward spreadsheet
10) Contact me if you’d like to review any of the spreadsheets enabling you to experiment with any potential outcome for any trade or your own risk/reward criteria.

 Peter Knight

 Source


 Source


