
Summary
Roosevelt’s economic stimulus vs. Obama’s: The discrepancies in leadership, priorities, and results are dramatic.
1933-1939 vs. 2009-2016 – You be the judge:
- 1933: Economic stimulus per capita: $746 (inflation-adjusted to $13,785 in 2016 dollars)
- 1933-1939: Federal debt to GDP moved from 39.40% to 43.25%
- 1933-1939: National debt per capita: $663 ($11,458 in 2016 dollars)
Vs.
- 2009: Economic stimulus per capita – $2,691 ($3,003 in 2016 dollars)
- 2008-2016: Bank bailouts already paid – $14,426 per capita
- 2008-2016: US commitment to bank bailouts – $16.8 trillion, $52,688 per capita
- 2008-2016: Federal debt-to-GDP ratio moved from 67.85% to 105.20%
- 2016: National debt per capita – $60,215
Roosevelt’s Economic Stimulus, The New Deal or “3Rs”, cost a total of $50 billion ($876 billion in 2016 dollars) to fund:
- Relief for the unemployed and poor;
- Recovery of the economy to normal levels; and
- Reform of the financial system to prevent a repeat recession or depression.
Roosevelt’s New Deal injected money directly into the economy, rebuilding infrastructure, creating jobs, enhancing the quality of life for the current and future generations of US citizens. Roosevelt’s economic stimulus was accompanied by accurate economic reporting, ensuring citizens could objectively monitor progress of their elected officials to ensure the United States was on the right path.
The face value of Obama’s“economic stimulus” was $858 billion ($960 billion in 2016 dollars), the majority of it tax credits and programs already on deck to be funded.
Roosevelt’s New Deal put millions of Americans back to work. The Civilian Conservation Corps alone employed over two million men (2.98% of the 1933 US population). New Deal programs built roads, bridges, dams, airports, railways, schools, courthouses, city halls, hospitals, post offices from coast to coast, strengthening America’s infrastructure and putting people who wanted to work back to work.
Obama’s stimulus was void of substance for US citizens. The majority of the stimulus package were tax incentives and programs already on deck to be funded; in other words, the $47 billion in handouts to aid low income and the unemployed was on deck to be funded, but were included in the American Recovery and Reinvestment Act of 2009 to increase the represented total stimulus amount.
Roosevelt’s New Deal projects included; the Triborough Bridge, LaGuardia Airport, Lincoln Tunnel, Overseas Highway, Dams in Tennessee, Shasta Dam in California, Hoover Dam on the Colorado River, Grand Coulee Dam in Washington State, the nation’s first freeway in Los Angeles, Golden Gate Bridge, San Francisco-Oakland Bay Bridge, 469-mile-long Blue Ridge Parkway, Great Smoky Mountains and Shenandoah National Park, just to name a few. See this SA post for pictures and more information in the New Deal projects.
Obama’s American Recovery and Reinvestment Act of 2009 showcased clean, renewable efficient energy programs.
Let’s compare Roosevelt’s 1933 New Deal clean, renewable and efficient energy programs to Obama’s in 2009
Obama’s clean, renewable, efficient energy programs cost $68.4 billion, plus tax incentives. President Obama said he “is committed to taking responsible stepsto address climate change, promote clean energy and energy efficiency, to ensure a cleaner, more stable environment for future generations” and “development of innovative, low-cost clean energy technologies for tomorrow” including rooftop solar, energy storage (batteries), smart grid technology, programmable thermostats, methane gas capture. The program also touted achieving an economy-wide target to reduce emissions by 26-28% below 2005 levels before 2025, but nothing big on wind (just tax credits) or hydroelectric power (Source: The White House).
What Obama’s $68.4 billion bought US taxpayers
Utility-scale solar in the US now averages 5 cents per kilowatt-hour (more than seven times the cost of hydroelectric power). All solar power in United States satisfies less than 0.5% of the US power needs.
Rooftop Solar

Source: PV-Tech
Energy storage (batteries)
Smart grid technology
Programmable thermostats

Methane gas capture
Cost of production, 7 cents per kilowatt-hour (kWh) or 10 times the cost of hydroelectric power; farmers also get a 4 cent per kilowatt-hour credit (Source: NY Times).

During Obama’s economic stimulus, new EPA carbon regulations came into play that according to the US Chamber of Commerce will increase energy costs, reduce GDP by $51 billion and cost 442,000 jobs by 2022.
Roosevelt’s idea in 1933 forclean, renewable and efficient energy programs was different
In the US, hydropower is produced for an average of 0.7 cents per kilowatt-hour (kWh) or 1/7 the cost of solar, 1/10th of methane gas capture.
Hydroelectric power is very efficient; “hydro turbines can convert as much as 90% of the available energy into electricity. The best fossil fuel plants are about 50% efficient.
The Hoover Dam cost $859 million in 2016 dollars
The dam’s construction employed thousands of workers. Now in its 81st year of operation, it continues to control flooding and provide water and clean energy to millions in Arizona, southern California, and southern Nevada. The Hoover Dam generates on average 4 billion kilowatt-hours of hydroelectric power each year. The plant has a rated capacity of 2,998,000 horsepower.

Shasta Dam in California cost $633 million in 2016 dollar
Construction employed thousands. Now in its 71st year of operation, it continues to control flooding and provide water and clean energy to millions in northern California.

The Grand Coulee Dam in Washington State cost $928 million in 2016 dollars
Construction employed thousands. Now in its 74th year of operation, it continues to control flooding and provide water and clean energy to millions of people in Washington State.

Total cost of the three dams: $2.68 billion in 2016 dollars
For more than 70 years, these dams have controlled floods and provided water and clean power to millions of homes and businesses at 1/3 to 1/10th the cost of the Obama clean energy programs.
Total cost of Obama’s clean energy programs: $68.4 billion
Cost of rebuilding America during the Great Depression
From 1933 to 1939, the national debt grew from $22.54 billion to $40.44 billion, or plus 79.41% (converted into 2016 dollars from $416.53 billion to $698.93 billion or + $284.40 billion).

Source: usgovernmentspending.com
From 2008 to 2016, the US national debt grew from $9.98 trillion to $19.43 trillion or plus 94.69%

Source: usgovernmentspending.com
Debt to GDP is where you see the difference between a stimulus program that works and one that doesn’t
One that works:
From 1933 to 1939, the Federal debt-to-GDP ratio moved from 39.40% to 43.25%.
Source: usgovernmentspending.com
One that doesn’t:
From 2008 to 2016, the Federal debt-to-GDP ratio moved from 67% to 105% (all-time high from World War II was 113%).
Source: usgovernmentspending.com
Roosevelt’s reforms, first executive order and first act as president
When Roosevelt took office, the Great Depression was crippling the US economy. In response, the new president called a special session of Congress the day after the inauguration and declared a four-day banking holiday that shut down the banking system, including the Federal Reserve. This action was followed a few days later by the passage of the Emergency Banking Act, which was intended to restore Americans’ confidence in banks when they reopened and rebuild confidence in the nation’s banking system.
Emergency Banking Act
- Title I expanded presidential authority during a banking crisis, including regulation of all banking functions, including “any transactions in foreign exchange, transfers of credit between or payments by banking institutions as defined by the President, and export, hoarding, melting, or earmarking of gold or silver coin.”
- Title II gave the comptroller of the currency the power to restrict the operations of a bank with impaired assets and to appoint a conservator, who “shall take possession of the books, records, and assets of every description of such bank, and take such action as may be necessary to conserve the assets of such bank pending further disposition of its business.”
- Title III allowed the secretary of the Treasury to determine whether a bank needed additional funds to operate and “with the approval of the President request the Reconstruction Finance Corporation to make loans secured.”
Other legislation also helped make the financial landscape more solid, such as the Banking Act of 1932 and the Reconstruction Finance Corporation Act of 1932. The Emergency Banking Act of 1933 itself is regarded by many as helping to set the nation’s banking system right during the Great Depression (Source: Federal Reserve Bank of St. Louis).
President Roosevelt attributed the Great Depression to “unscrupulous bankers and money lenders”. He let them go bankrupt, his administration “tried to jail those responsible” for enabling rampant speculation and “unethical lending practices of the banks that led the eventual crash of 1929 (1932-34 Pecora Hearings). Unfortunately, there were no specific rules in place to prosecute “unscrupulous bankers and money lenders” and he created the SEC to try and prevent future abuses.
Many of Roosevelt’s New Deal programs remain active today, with some still operating under the original names, including the Federal Deposit Insurance Corporation (FDIC), the Federal Crop Insurance Corporation , the Federal Housing Administration (FHA), the Tennessee Valley Authority (TVA), the Securities and Exchange Commission (SEC) and the largest Social Security.
Roosevelt accomplished this as he recovered from polio and dealt with Hitler (Germany), Mussolini (Italy) and Hirohito (Japan) and prepared the United States for, and to win World War II.
Obama’s reforms, first executive order and fist act as president
Obama took office January 20, 2009. Like 1933, in 2009, the US was in the bowels of a financial crisis; unemployment was at a 25-year high and climbing.
After a flubbed oath of office that forced him to take it over again, he gave a strangely uninspiring and forgettable address. President and Mrs. Obama found time for Hollywood celebrities, Washington glitterati, and politicos of every shape and size, but somehow had no room on their dance card for the 48 Medal of Honor winners who attended the “Salute to Heroes” ball. It was the first time in the ball’s 56-year history the Commander in Chief was a no show.
The day after the inauguration as the 44th president, his first executive order was to officially close off his personal records to the public.
Nine days later his first act, the Lilly Ledbetter Fair Pay Act of 2009. The act states that the 180-day statute of limitations for filing an equal-pay lawsuits regarding pay discrimination resets with each new paycheck affected by that discriminatory action.
Obama’s reforms and policy on the banking crisis
Rather than try hold those responsible for the banking crisis accountable as Roosevelt did, Obama’s “economic stimulus” continued to supplement the $700 billion President Bush authorized for the banks in October 2008.
According to the Special Inspector General for TARP, the bailout commitment total for the US government is now up to $16.8 trillion with $4.6 trillion already paid out. Yes, it was trillions not billions, and the banks are now even larger and still too big to fail. $16.8 trillion bank bailout commitments equates to $116,525 per taxpayer, $52,688 per capita. $4.6 trillion that has already been paid out equates to $31,905 per taxpayer, $14,426 per capita (Sources: Inspector General and Forbes).
Economic stimulus for the US taxpayer and citizen was more modest with a face value $858 billion (including tax incentives); the $858 billion equates to $5,951 per taxpayer or $2,610 per capita.
February 17, 2009, American Recovery and Reinvestment Act. The primary purpose of ARRA was to save and create jobs almost immediately. Secondary purpose to provide temporary relief programs for those most affected by the recession.
April 27, 2009, Obama “buzzes” New York City in Air Force One, causing 911 survivors to panic.
May 15, 2009, provision of the stimulus package caused outrage in the Canadian business community. The government in Canada “retaliated” by enacting restrictions on trade with the US.
The American Recovery and Reinvestment Act of 2009, Obama’s “solution to the Great Recession.”

It gets even worse
“Economic stimulus” drops to about $42 billion after you pull out the tax credits, pork barrel energy programs and what was already on deck to be paid. $42 billion equates to about $291 per taxpayer, or $131.72 per capita.

What “economic stimulus” did for savers
$42 billion is 4.25% of the minimum we know that savers lost in interest income from the largest negative rates of return in history for the longest period of time in history (This also assumes that you are in the 9% minority who give current BLS.GOV inflation calculations creditability).
The math on negative rates of return
1957 to 2007
- Average Treasury rate = 6.48%
- Average reported CPI = 4.10%
- Average positive rate of return = +2.38%

Source: Federal Reserve
Positive rate of return; the CPI (in red) is below deposit rates.
Source Federal Reserve
Negative rate; the reported CPI (in red) is above deposit rates.
Source: Federal Reserve
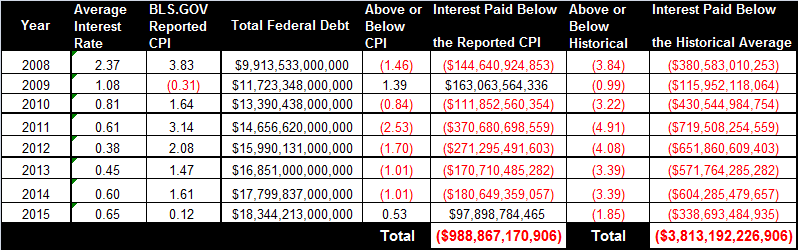
What negative rates of return have cost savers
Nearly $1 trillion confirmed in negative rates of return (below the CPI). Over $3.8 trillion relative to the 1957-2007 positive rate of return average.
Source: Federal Reserve
In reality it’s likely far worse than a total of $3.8 trillion
91% of professional traders surveyed believe inflation is being under reported, 63% believe true inflation is twice what is reported. Pre-1980 BLS.GOV inflation calculation methods measure a constant standard of living; current methods measure a minimum standard of living. 1980 pre-revision BLS.GOV calculation methods put inflation three times higher than what is currently reported by the BLS.GOV.
The CPI not only dictates Treasury rates, but all other governmental expenditures that are linked to the CPI rate like Social Security benefit increases.
From 2008 to 2015, an average of $1.2 trillion has been removed from the economy annually due to lost interest income on US Treasury debt and increases that did not occur to Social Security recipients directly as a result of the current inflation misrepresentations by the BLS.GOV. Details, all supporting charts and data:

How does striping savers, Social Security recipients, soldiers, policemen, firemen, every other government employee, their suppliers and the free market out of trillions “stimulate an economy”?
What did economic stimulus do for borrowers?
- In 2009, the Fed Funds bank borrowing rate dropped to 0.13%,
- the prime rate remained unchanged at 3.25% until December 2015, then bumped up to 3.50%, and
- consumer credit card rates remained above 13.00%, close to the 20-year average of 14.22%.
Fed Funds bank borrowing rate (red) relative to bank lending rates:
Red = Fed Funds bank borrowing rate
Black = Prime lending rate
Green = Average credit card rate
Blue = 30-year conventional mortgage rate
Source: Federal Reserve
Not that Japan is any example to follow, but when Japan’s deposit rates went to zero, the Japanese at least had the conscience to lower their prime lending rate to 0.95%
At 0.95%, Japan’s prime rate is less than 1/3 of the 3.00% gross profit margin between the US Fed Funds rate and prime lending rate.

Source: Bank of Japan
What “economic stimulus” did for the US Treasury
- Enabled the Treasury to finance over 10 trillion in new deficit spending at the lowest rates in history.
- Allowed the US Treasury to refinance existing Federal debt at the lowest rates in history (Maturity Extension Program).
- Locked in the US Treasury’s debt service cost at the lowest rates for the longest period of time in history; the average US Treasury duration is now nearly six years, and average yield less than 2.75%.
Red = Federal debt
Blue = Federal debt held by Federal Reserve banks
Light Blue = Social Security
Green = Federal debt service cost that the Fed stopped reporting
Source: Federal Reserve
What “economic stimulus” did for the US economy
The US debt to GDP ratio is currently the worst since World War II at 105% and is quickly closing in on the all-time high of 113%.
- Current debt-to-GDP ratio, 105%
- Debt to GDP in 2009 when “economic recovery” officially began, 80.10%
- Debt to GDP at the height of the Great Depression, 39%
- All-time high debt to GDP during World War II, 113%

Source: Federal Reserve
Budget deficits still exceed $400+ billion annually. Each 1.00% increase in debt service will add $192 billion to the current $400+ billion annual deficits.

Source: Federal Reserve
The tax receipt growth to Federal debt ratio is by far the worst in history. From 2008 to 2015, the US national debt increased by 104% while tax receipts increased by only 36%.
If rates rise, it will crush tax receipts and eventually generate new high annual budget deficits.
Red = National debt
Green = Debt service cost
Black = Personal income tax receipts
Blue = Corporate tax receipts
The worst debt to personal income ratio in history
Red = National debt
Green = Personal income Source: Federal Reserve
The worst debt to employed population ratio in history.
Red = National debt
Green = Non-farm payroll
Black = Total population
Source: Federal Reserve
Millions in the US annually are still losing their homes.
- US Mortgage delinquency rates remain at 6.16% in 2016
- 6.16% is nearly twice the pre-recession all-time high of 3.36%
- Nearly three times the pre-recession average of 2.24%

Source: Federal Reserve
Home ownership in the 21st century is at a new all-time low.
Source: Federal Reserve
The worst trade deficits on record; over $5 trillion has left the US for foreign shores since “economic stimulus and recovery” began.
- From 1960 to 2007, the cumulative trade deficit was $7.73 trillion
- From 2008 to 2016, $5.13 trillion
- Cumulative total increase from 2008 to 2016 66.31%
Since 1960, $12.86 trillion in wealth has transferred from domestic to foreign accounts.
Source 1960-2013 Federal Reserve
Source 2014-2016 Trading Economics
“Quantitative Easing,” which leads to inflation and dollar devaluation.
“Quantitative Easing” created $4.19 trillion with keypunch entries backed by no tangible assets or income flow to:
- Bail out the banks that facilitated the debt crisis.
- Purchase record amounts of US Federal debt that no one else would buy at non competitive interest rates.
- Force and hold rates at historic lows enabling the US Treasury to finance over $10 trillion in new Federal debt at the lowest rates in history.
$4.19 trillion is nearly five times greater than total Federal debt was during the “inflationary debt crisis” of 1980 when short-term rates soared above 18%.
- 1980 Federal debt = 863 billion ($2.50 trillion in 2016 dollars)
- 2016 Federal debt = 19.23 trillion
Fed’s balance sheet
Red = 2.46 trillion in US Treasury
Green = 1.73 trillion in bad bank debt
Source: Federal Reserve
During the “economic stimulus,” the US attained and maintained the worst debt rating in its history.
13 countries now have a higher debt rating than the US; most have the same or higher deposit rates.

How the US did against China, the world’s second largest economy during “economic stimulus”
China by the Fed’s own numbers buried the US during “economic stimulus and recovery.”
The worst growth ratio on record against China.
Blue = US GDP growth
Red = China GDP growth
Source: Federal Reserve
The worst debt-to-GDP ratio on record.
Blue = US debt to GDP
Red = China’s debt to GDP
Source: Federal Reserve
The “balance” of trade was beyond ugly
Blue = US “balance” of trade
Red = China’s “balance” of trade
Source: Federal Reserve
The widest spread on record between the US’s and China’s short-term interest rates.

Source: Federal Reserve
During “economic stimulus and recovery,” the USD had an overall depreciation of 10.27% against the Chinese renminbi despite massive intervention by the Chinese to devalue their currency.
Source: Federal Reserve
The World Bank tells us China’s economy will surpass the US’s by 2019.
Greenspan enabled the financial crisis
Greenspan’s agenda one week after leaving the Fed.
7 February, 2006, Lehman Brothers paid Greenspan $250,000 to meet with 15 of its most important hedge fund clients in Lehman’s executive dining room. Greenspan’s primary theme was the white-hot U.S. housing market was slowing down, but evidence of it would not show up statistically for several months and it could take more than a year.
Housing prices fell, global investor demand for mortgage-related securities evaporated, many of the attendees at the 7 February, 2016, Lehman Brothers dinner that negated Greenspan’s advice watched their hedge funds implode as subprime mortgage failures ignited the largest financial crisis in US history.
15 September, 2008, Lehman Brothers filed for bankruptcy; at the time, it was the largest BK in history, as its assets far surpassed those of previous bankrupt giants such as WorldCom and Enron.
In the video below Greenspan apologized for nearly two decades of failed monetary policy that put the US into the largest financial crisis in history, but kept Lehman’s 250K fee and still earns over 100K per “speaking engagement”
Bernanke made it worse
31 January, 2006, Bernanke becomes Fed chair. How could this clueless wonder calls on the market earn him the job to navigate the US out of crisis.
They didn’t, most traders I know believe Bernanke was put in because he was clueless after Greenspan get the Fed into so much trouble by essentially enabling the banking crisis.
Fed independence from the US government collapsed. The US government gave the Fed two options, do exactly what you’re told or we’ll audit you for the first time in 102 years. An audit would pull your alumni off the 25K to 250K per hour speaking tour and onto the jail tour. Bernanke assumed the position for the Federal Treasury rather than the Federal Justice System and currently receives 100K to 250K an hour on the speaking tour.
Now Grandma Yellen has assumed the position and is doing exactly what she is told by the federal Government telling economic recovery fairy tales that no one believes.
Fed creditability with the market is at a new all-time low
Yellen’s latest fairytale tells us the economy is in “recovery,” and there will be eight rate hikes between now and December 2018; the market says less than two.
A-C on the chart below shows the market’s expectations for rate hikes:
A) In June 2011, the market was pricing in three 0.25% rate hikes by March 2019, with the spread between the September 2016 (GEU16) and March 2019 (GEH19) deliveries at 0.75, position value at $1,875.
B) By November 2013, optimism for US economic recovery and rate normalization peaked with the market pricing in nine 0.25% rate hikes, the spread moved to 2.25, position value $5,625.00 USD.
C) Current rate hike expectations have dropped to less than two 0.25% hikes, with the spread at 0.3750, position value at $937.50.
D) If the market had faith in the Fed, the spread between the September 2016 (GEU16) and March 2019 (GEH19) deliveries would be 2.25, reflecting the Fed’s expected eight 0.25% hikes; position value $5,625.00.
E) I think the Fed is lying about the economic recovery and rate hikes while the market is overly pessimistic (basically it’s telling you to move down into the bunker). I believe we’ll see four 0.25 rate hikes between now and March 2019. I’m in this position at 0.3750 position value $937.50, my objective is 0.8750 position value $2,187.50 quotes. I believe the rate hike won’t be generated by “economic recovery,” but the US’s inability to borrow as it fires up more QE and its debt creditability erodes. Give new meaning to the phrase “collateral damage” (as in borrowing collateral):
 The only way the US can fix its debt problem with more debt is if the money borrowed goes to programs like Roosevelt’s which injected money directly into the economy.
- 1933 economic stimulus per capita; $746 or $13,785 in 2016 dollars
- 1933 to 1939, the Federal debt-to-GDP ratio moved from 39.40% to 43.25%
- 1939 national debt per capita $663 or $11,458 in 2016 dollars
Obama’s stimulus injected money directly into the banks that caused the problem, and pork programs at the same, it removed money from the economy through negative rates of return and BLS.GOV inflation misrepresentations.
- 2009 economic stimulus per capita; $2,691 or $3,003 in 2016 dollars
- 2008-2016 Bank bailouts already paid per capita $14,426
- 2008 to 2016, the Federal debt-to-GDP ratio moved from 67.85% to 105.20%
- 2016 national debt per capita $60,215
- 2016 total bank bailouts guaranteed by the US government $52,688 per capita
Trying to fix a bad debt problem with an even greater bad debt has and never will work.
Hopefully, the FOMC will figure out Banqiao banking just doesn’t work and misreporting inflation may work in the short term, but will have horrific long-term consequences.
FOMC voting members who determine monetary policy and set rates for the United States

Enough of the bad news
The good news is the bad news generates major market moves and powerful trends. It’s going to be a fun year for traders who are on their game and have strategies in place to capture them.
If Greece, a country with a GDP the size of Orange County, California, or the UK (3.94% of global GDP), can generate the moves we’ve seen, just think of how much fun we’re going to have in the US markets (23.32% of global GDP) with the kind of fundamentals we have and an election year on deck.
My purpose in writing these long-winded articles is so I can reference them on this site over the next year as I write about specific trades in shares, indices, debt instruments, currencies, metals and energies.
I think it’s time for all to brush on the sectors you’ve forgotten about, your shorting and collar strategies. Metals are sure to shine, debt instruments look like they be a downer (rates higher), and we should have the opportunity to pick up our favorite US shares at much better prices after the selling hemorrhage stalls.
Few of my favorite US stocks and ETFs I’ll be writing about use my own trades as examples (both short and long). If there is interest, I’ll expand to international markets.
- Apple (NASDAQ:(AAPL)
- Bank of America (NYSE:BAC)
- Microsoft (NASDAQ:MSFT)
- Alphabet ([[GOOG]], [[GOOGL]])
- Pfizer (NYSE:PFE)
- Cisco (NASDAQ:CSCO)
- Goldman Sachs (NYSE:GS)
- Moody’s (NYSE:MCO)
- Oracle (NYSE:ORCL)
- AT&T (NYSE:T)
- AbbVie (NYSE:ABBV)
- JPMorgan Chase (NYSE:JPM)
- Baxter International, Inc. (NYSE:BAX)
- General Electric Company (GE)
- SPDR S&P 500 Trust ETF (SPY)
- SPDR Dow Jones Industrial Average ETF (DIA)
- iShares MSCI Emerging Markets ETF (EEM)
- SPDR S&P Metals and Mining ETF (XME)
- SPDR Gold Trust ETF (GLD)
- iPath S&P 500 VIX Short-Term Futures ETN (VXX)
- Market Vectors Gold Miners ETF (GDX)
- Ford Motor Company (F)
- Financial Select Sector SPDR ETF (XLF)
- iShares China Large-Cap ETF (FXI)
- Shares Russell 2000 ETF (IWM)
- COMEX Gold Trust (IAU)
- Physical Swiss Gold Shares (SGOL)
- DB Gold Fund (DGL)
- DB Gold Double Long ETN (DGP)
- UltraShort Gold (GLL)
- Gold Trust (OUNZ)
- Ultra Gold (UGL)
- DB Gold Double Short ETN (DZZ)
- 3x Long Gold ETN (UGLD)
- DB Gold Short ETN (DGZ)
- 3x Inverse Gold ETN (DGLD)
- Gartman Gold/Yen ETF (GYEN)
- Gartman Gold/Euro ETF (GEUR)
- E-TRACS UBS Bloomberg CMCI Gold ETN (UBG)
- X-Links Gold Shares Covered Call ETN )GLDI)
Derivatives
- Precious metals
- Energy
- Debt instruments
- Currencies
- S&P 500
- Dow
- NASDAQ 100
- FTSE 100
- EuroStoxx 50
- Nikkei 225
Volatility will be high, so trade with the trend; when possible, use option collars to define your risk on trades and for the duration of every trading period.
I run a family office from the Virgin Islands, have about 1/3 of assets in US markets and like to get some online international camaraderie going as we batten down the hatches getting ready for the next leg of this adventure.
I have been a professional trader for over 20 years including time on the floor. My sole professional purpose is the preservation and enhancement of family wealth. I don’t sell a newsletter, I don’t manage US funds (only non-US), but I do enjoy trading the liquidity of US markets, especially on days like Brexit.
Good luck, America. I can feel the pain and disappointment you must being going through looking at your economic numbers. I sure hope you can come up with a better line up of leaders this fall.