RISK DISCLOSURE –


The risk of loss in trading foreign exchange can be substantial. You should therefore carefully consider whether such trading is suitable in light of your financial condition. You may sustain a total loss of funds and any additional funds that you deposit with your broker to maintain a position in the foreign exchange market. Actual past performance is no guarantee of future results. Simulated performance results also have certain limitations unlike actual performance records, simulated results do not represent composite trading. Also, since trades have not actually been executed for this composite, the results may have under-or-over compensated for the impact, if any, of certain market factors, such as lack of liquidity, simulated trading results, in general are also subject to the fact they are designed with the benefit of hindsight. No representation can or is being made that any trading system will, or is likely, to achieve profits or losses similar to those shown in this simulated performance record.

The performance records have been calculated in a manner we believe to be reasonable and is based on the respective leverage factors intended to be used. Prospective investors must recognize that any simulation of a hypothetical record, even when based on actual trading systems, with qualified trade execution, has inherent limitations. We believe that the records as presented should be of interest to investors in determining whether to participate, such rates of return should by no means be taken as an indication of how the system will perform or would have performed, even given the same trades. Any performance record compiled from individual performance records of any trading methodologies has certain hypothetical and artificial characteristics and must be evaluated accordingly.

The risk of loss in trading commodities can be substantial.You should therefore carefully consider whether such trading is suitable for you in light of your financial condition. The high degree of leverage that is often obtainable in commodity trading can work against you as well as for you. The use of leverage can lead to large losses as well as gains.In some cases, managed commodity accounts are subject to substantial charges for management and advisory fees. It may be necessary for those accounts that are subject to these charges to make substantial trading profits to avoid depletion or exhaustion of their assets. The disclosure document of a commodity trading advisor (“CTA”) contains a complete description of the principal risk factors and each fee to be charged to your account by the CTA.

HYPOTHETICAL PERFORMANCE RESULTS HAVE MANY INHERENT LIMITATIONS, SOME OF WHICH ARE DESCRIBED BELOW. NO REPRESENTATION IS BEING MADE THAT ANY ACCOUNT WILL OR IS LIKELY TO ACHIEVE PROFITS OR LOSSES SIMILAR TO THOSE SHOWN. IN FACT, THERE ARE FREQUENTLY SHARP DIFFERENCES BETWEEN HYPOTHETICAL PERFORMANCE RESULTS AND THE ACTUAL RESULTS SUBSEQUENTLY ACHIEVED BY ANY PARTICULAR TRADING PROGRAM. ONE OF THE LIMITATIONS OF HYPOTHETICAL PERFORMANCE RESULTS IS THAT THEY ARE GENERALLY PREPARED WITH THE BENEFIT OF HINDSIGHT. IN ADDITION, HYPOTHETICAL TRADING DOES NOT INVOLVE FINANCIAL RISK AND NO HYPOTHETICAL TRADING RECORD CAN COMPLETELY ACCOUNT FOR THE IMPACT OF FINANCIAL RISK IN ACTUAL TRADING. FOR EXAMPLE, THE ABILITY TO WITHSTAND LOSSES OR TO ADHERE TO A PARTICULAR TRADING PROGRAM IN SPITE OF TRADING LOSSES ARE MATERIAL POINTS WHICH CAN ALSO ADVERSELY AFFECT ACTUAL TRADING RESULTS. THERE ARE NUMEROUS OTHER FACTORS RELATED TO THE MARKETS IN GENERAL OR TO THE IMPLEMENTATION OF ANY SPECIFIC TRADING PROGRAM WHICH CANNOT BE FULLY ACCOUNTED FOR IN THE PREPARATION OF HYPOTHETICAL PERFORMANCE RESULTS AND ALL OF WHICH CAN ADVERSELY AFFECT ACTUAL TRADING RESULTS.

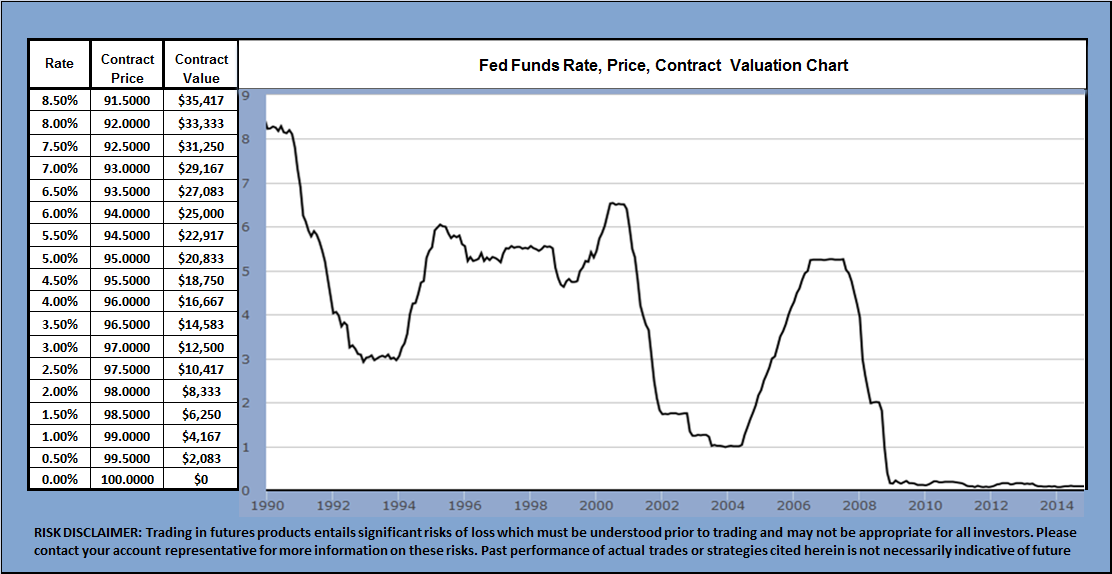
What capturing the long term move higher in rates is worth

Trading rates higher requires a short position.

1) Click here to enlarge the valuation chart below, here for current quotes.

Screenshot_449

2)  Click here for where the Fed sees rates & when

3) To convert contract price into rate it represents take 100.00 – contract price = rate
4) Current Fed funds contract price 99.55 (ZQH16), rate 0.45%, value = $1,875
5) Each 0.01 change is price = $41.67 (up = -$41.67, down +$41.67)
6) Contract price at the September 2013 low 98.60, rate 1.60%, value = $6,667

To experiment with any potential outcome for this trade

7)  Click here and open the March 2016 risk reward spreadsheet (no hedge)

Enter any contract price into cell B-2
Net profit or loss will show in cell E-2
Liquidating value shows in cell F-2

Screenshot_448

Hedged strategies with a higher return on risk

8)   March 2016 100
9)   March 2016 25
10) March 2016 10
11) March 2016 5

If you’d like me to review this and other strategies for trading global rates higher through 2018 contact me.

Major events on deck that will generate major market moves across the board

12)  Click here China’s currency the Renminbi joins the world’s reserve currencies October 2015

13) Click here The U.S. can no longer service 18 trillion in debt with only 1.8 trillion in annual tax receipts, the current national debt to tax receipt ratio is unsustainable and now irreversible.

With China’s currency the Renminbi on deck to become a world reserve currency in October 2015 I believe will see major market moves in currencies that could rival 2008 below are several programs to capture these moves.

14) Our Structure

Fees
Front load = 0.00%
Management fee 0.00%
Inventive Fee = 10.00% of net new high profits quarterly

To open a test account enabling you to get comfortable with our team

15) Direct FX opening instructions
16) Clearing and Exchange Members for larger accounts

17) The world’s largest dollar volume exchange group
18) CME videos
19) Due Diligence and how funds are protected
20) Commodity Futures Trading Commission

If you have questions or would like additional information please call
with this page available.

x

Click here for contact details


———————————————————————————————————————————–

RISK DISCLOSURE STATEMENT

Program availability is dependent on your country of residency; assets, experience and net worth please contact us for details.

PAST RESULTS ARE NOT NECESSARILY INDICATIVE OF FUTURE RESULTS. EXAMPLES OF HISTORIC PRICE MOVES OR EXTREME MARKET CONDITIONS ARE NOT MEANT TO IMPLY THAT SUCH MOVES OR CONDITIONS ARE COMMON OCCURRENCES OR ARE LIKELY TO OCCUR.

HYPOTHETICAL PERFORMANCE RESULTS HAVE MANY INHERENT LIMITATIONS, SOME OF WHICH ARE DESCRIBED BELOW. NO REPRESENTATION IS BEING MADE THAT ANY ACCOUNT WILL OR IS LIKELY TO ACHIEVE PROFITS OR LOSSES SIMILAR TO THOSE SHOWN. IN FACT, THERE ARE FREQUENTLY SHARP DIFFERENCES BETWEEN HYPOTHETICAL PERFORMANCE RESULTS AND THE ACTUAL RESULTS SUBSEQUENTLY ACHIEVED BY ANY PARTICULAR TRADING PROGRAM. ONE OF THE LIMITATIONS OF HYPOTHETICAL PERFORMANCE RESULTS IS THAT THEY ARE GENERALLY PREPARED WITH THE BENEFIT OF HINDSIGHT.

IN ADDITION, HYPOTHETICAL TRADING DOES NOT INVOLVE FINANCIAL RISK, AND NO HYPOTHETICAL TRADING RECORD CAN COMPLETELY ACCOUNT FOR THE IMPACT OF FINANCIAL RISK IN ACTUAL TRADING. FOR EXAMPLE, THE ABILITY TO WITHSTAND LOSSES OR TO ADHERE TO A PARTICULAR TRADING PROGRAM IN SPITE OF TRADING LOSSES ARE MATERIAL POINTS WHICH CAN ALSO ADVERSELY AFFECT ACTUAL TRADING RESULTS. THERE ARE NUMEROUS OTHER FACTORS RELATED TO THE MARKETS IN GENERAL OR TO THE IMPLEMENTATION OF ANY SPECIFIC TRADE PROGRAM WHICH CANNOT BE FULLY ACCOUNTED FOR IN THE PREPARATION OF THE HYPOTHETICAL PERFORMANCE RESULTS AND ALL OF WHICH CAN ADVERSELY AFFECT ACTUAL TRADING RESULTS.

BID/ASK SPREADS, BROKERAGE COMMISSION, CLEARING, EXCHANGE AND REGULATORY FEES WILL HAVE AN ADVERSE IMPACT ON THE NET OVERALL PERFORMANCE OF YOUR ACCOUNT. PRIOR TO MAKING A DECISION TO PARTICIPATE IN ANY INVESTMENT MAKE SURE YOU FULLY UNDERSTAND THE FEES ASSOCIATED WITH TRADING.

THE INFORMATION PROVIDED IN THIS REPORT CONTAINS RESEARCH, MARKET COMMENTARY AND TRADE RECOMMENDATIONS. YOU MAY BE SOLICITED FOR AN ACCOUNT BY PRIMARY ASSETS MANAGEMENT OR ONE OF ITS REPRESENTATIVES OR EMPLOYEES. IT SHOULD BE KNOWN THAT THE REPRESENTATIVES OF PRIMARY ASSETS MANAGEMENT MAY TRADE FUTURES AND OPTIONS FOR THEIR OWN ACCOUNTS OR THOSE OF OTHERS. DUE TO VARIOUS FACTORS (SUCH AS MARGIN REQUIREMENTS, RISK FACTORS, TRADING OBJECTIVES, TRADING INSTRUCTIONS, TRADING STRATEGIES, AND OTHER FACTORS) SUCH TRADING MAY RESULT IN THE LIQUIDATION OR INITIATION OF FUTURES OR OPTIONS POSITIONS THAT DIFFER FROM THE OPINIONS AND RECOMMENDATIONS FOUND IN THIS REPORT.

PAST PERFORMANCE IS NOT NECESSARILY INDICATIVE OF FUTURE PERFORMANCE. THE RISK OF LOSS IN TRADING FUTURES CONTRACTS OR COMMODITY OPTIONS CAN BE SUBSTANTIAL, AND THEREFORE INVESTORS SHOULD UNDERSTAND THE RISKS INVOLVED IN TAKING LEVERAGED POSITIONS AND MUST ASSUME RESPONSIBILITY FOR THE RISKS ASSOCIATED WITH SUCH INVESTMENTS AND FOR THEIR RESULTS.

YOU SHOULD CAREFULLY CONSIDER WHETHER SUCH TRADING IS SUITABLE FOR YOU IN LIGHT OF YOUR CIRCUMSTANCES AND FINANCIAL RESOURCES. YOU SHOULD READ THE “RISK DISCLOSURE” WEBPAGE ACCESSED AT THE TOP OF THE HOMEPAGE. PRIMARY ASSETS MANAGEMENT IS NOT AFFILIATED WITH NOR DOES IT ENDORSE ANY TRADING SYSTEM, NEWSLETTER OR OTHER SIMILAR SERVICE.


China by the numbers & world currency status –

Banks calling for a new world reserve currency
IMF/World Bank news
China & the IMF

U.S. versus China’s growth, U.S. in blue, China in red

1) Click here for a current Fed chart

Screenshot_411

U.S. Trade surplus or deficit

2) Click here for a current chart

Screenshot_413

China trade surplus or deficit

3) Click here for a current chart

Screenshot_415

U.S. versus China’s debt to Gross Domestic Product  (GDP)

4) Click here for a current chart

Screenshot_416

U.S. versus China’s interest rates

5) Click here for a current chart

Screenshot_417

Some 95 per cent of all global foreign exchange reserves are invested in just four currencies: the US dollar, the euro, the yen and sterling. The central banks of the ‘Big Four’ are all expanding their balance sheets or have been doing so for years with no sign of immediate reversal. They are all trying to convert huge debt problems into inflation problems, and when they succeed their currencies will weaken sharply.

In this currency war, EM central banks risk suffering the most collateral damage. Their reserves – so many of them held in the big four currencies – will be decimated in purchasing power terms. The world will become desperate for alternative currencies to act as replacements for the traditional reserve currencies once their currency debasement efforts really take root.

So far, only one country, China, appears to have spotted the opportunities presented by this situation. Most others merely watch the dollar in fear.

China’s renminbi will become a global reserve currency in the not too distant future. China will benefit enormously from becoming a global reserve currency – not only will its currency become far more stable, but China will also no longer need so many reserves. The excess reserves can then be used for sovereign wealth fund purposes, including the AIIB. Finally, China will be able to increase consumption, because it no longer needs to suppress domestic demand in order to maintain high levels of reserves.

But the world will need more new reserve currencies than just the renminbi. This means that other large EM countries such as Mexico, Brazil, India and others could also benefit from the opportunity that China is now exploiting. With sensible planning and prudent policy implementation, they too can become global reserve currencies.

Technocrats in EM central banks are aware of these issues but face tremendous challenges in convincing their boards of the need to diversify into other currencies. That is why China’s move is so important. The renminbi’s ascent to reserve currency status will demonstrate the huge benefits of diversifying away from the ‘Big Four’ currencies. China will soon have to sell treasuries as its reserves become true ‘excess’ reserves. It is likely to seek to invest the cash in less mainstream currencies. Other EM central banks will ultimately reciprocate by buying renminbi. As each major EM central bank diversifies, not only will it be good for other EM currencies, it will also help all of them to reduce their excess exposures to the ‘Big Four’ QE currencies.


In preparation of the Renminbi becoming a World Reserve Currency the World’s largest dollar volume exchange group has listed Renminbi futures against both the USD and Euro.

10) Offshore Chinese Renminbi Market CME report

Screenshot_418

Renminbi Versus the USD

11) Chinese Renminbi/USD Futures
12) Chinese Renminbi/USD Quotes

Renminbi Versus the Euro 

13) Chinese Renminbi/Euro Futures
14) Chinese Renminbi/Euro quotes

15) Our Structure

Front load = 0.00%
Management fee 0.00%
Incentive fee = 10.00% of net new high profits quarterly

To open a test account enabling you to get comfortable with our team

16) Direct FX opening instructions
17) Clearing and Exchange Members for larger accounts
18) The world’s largest dollar volume exchange group
19) CME videos
20) Due Diligence and how funds are protected
21) Commodity Futures Trading Commission

If you have questions or would like additional information please call
with this page available.

x

Click here for contact details


 ————————————————————————————————————————————————–


RISK DISCLOSURE STATEMENT

Program availability is dependent on your country of residency; assets, experience and net worth please contact us for details.

PAST RESULTS ARE NOT NECESSARILY INDICATIVE OF FUTURE RESULTS. EXAMPLES OF HISTORIC PRICE MOVES OR EXTREME MARKET CONDITIONS ARE NOT MEANT TO IMPLY THAT SUCH MOVES OR CONDITIONS ARE COMMON OCCURRENCES OR ARE LIKELY TO OCCUR.

HYPOTHETICAL PERFORMANCE RESULTS HAVE MANY INHERENT LIMITATIONS, SOME OF WHICH ARE DESCRIBED BELOW. NO REPRESENTATION IS BEING MADE THAT ANY ACCOUNT WILL OR IS LIKELY TO ACHIEVE PROFITS OR LOSSES SIMILAR TO THOSE SHOWN. IN FACT, THERE ARE FREQUENTLY SHARP DIFFERENCES BETWEEN HYPOTHETICAL PERFORMANCE RESULTS AND THE ACTUAL RESULTS SUBSEQUENTLY ACHIEVED BY ANY PARTICULAR TRADING PROGRAM. ONE OF THE LIMITATIONS OF HYPOTHETICAL PERFORMANCE RESULTS IS THAT THEY ARE GENERALLY PREPARED WITH THE BENEFIT OF HINDSIGHT.

IN ADDITION, HYPOTHETICAL TRADING DOES NOT INVOLVE FINANCIAL RISK, AND NO HYPOTHETICAL TRADING RECORD CAN COMPLETELY ACCOUNT FOR THE IMPACT OF FINANCIAL RISK IN ACTUAL TRADING. FOR EXAMPLE, THE ABILITY TO WITHSTAND LOSSES OR TO ADHERE TO A PARTICULAR TRADING PROGRAM IN SPITE OF TRADING LOSSES ARE MATERIAL POINTS WHICH CAN ALSO ADVERSELY AFFECT ACTUAL TRADING RESULTS. THERE ARE NUMEROUS OTHER FACTORS RELATED TO THE MARKETS IN GENERAL OR TO THE IMPLEMENTATION OF ANY SPECIFIC TRADE PROGRAM WHICH CANNOT BE FULLY ACCOUNTED FOR IN THE PREPARATION OF THE HYPOTHETICAL PERFORMANCE RESULTS AND ALL OF WHICH CAN ADVERSELY AFFECT ACTUAL TRADING RESULTS.

BID/ASK SPREADS, BROKERAGE COMMISSION, CLEARING, EXCHANGE AND REGULATORY FEES WILL HAVE AN ADVERSE IMPACT ON THE NET OVERALL PERFORMANCE OF YOUR ACCOUNT. PRIOR TO MAKING A DECISION TO PARTICIPATE IN ANY INVESTMENT MAKE SURE YOU FULLY UNDERSTAND THE FEES ASSOCIATED WITH TRADING.

THE INFORMATION PROVIDED IN THIS REPORT CONTAINS RESEARCH, MARKET COMMENTARY AND TRADE RECOMMENDATIONS. YOU MAY BE SOLICITED FOR AN ACCOUNT BY PRIMARY ASSETS MANAGEMENT OR ONE OF ITS REPRESENTATIVES OR EMPLOYEES. IT SHOULD BE KNOWN THAT THE REPRESENTATIVES OF PRIMARY ASSETS MANAGEMENT MAY TRADE FUTURES AND OPTIONS FOR THEIR OWN ACCOUNTS OR THOSE OF OTHERS. DUE TO VARIOUS FACTORS (SUCH AS MARGIN REQUIREMENTS, RISK FACTORS, TRADING OBJECTIVES, TRADING INSTRUCTIONS, TRADING STRATEGIES, AND OTHER FACTORS) SUCH TRADING MAY RESULT IN THE LIQUIDATION OR INITIATION OF FUTURES OR OPTIONS POSITIONS THAT DIFFER FROM THE OPINIONS AND RECOMMENDATIONS FOUND IN THIS REPORT.

PAST PERFORMANCE IS NOT NECESSARILY INDICATIVE OF FUTURE PERFORMANCE. THE RISK OF LOSS IN TRADING FUTURES CONTRACTS OR COMMODITY OPTIONS CAN BE SUBSTANTIAL, AND THEREFORE INVESTORS SHOULD UNDERSTAND THE RISKS INVOLVED IN TAKING LEVERAGED POSITIONS AND MUST ASSUME RESPONSIBILITY FOR THE RISKS ASSOCIATED WITH SUCH INVESTMENTS AND FOR THEIR RESULTS.

YOU SHOULD CAREFULLY CONSIDER WHETHER SUCH TRADING IS SUITABLE FOR YOU IN LIGHT OF YOUR CIRCUMSTANCES AND FINANCIAL RESOURCES. YOU SHOULD READ THE “RISK DISCLOSURE” WEBPAGE ACCESSED AT THE TOP OF THE HOMEPAGE. PRIMARY ASSETS MANAGEMENT IS NOT AFFILIATED WITH NOR DOES IT ENDORSE ANY TRADING SYSTEM, NEWSLETTER OR OTHER SIMILAR SERVICE.

A Better Way to Trade Using Defined Risk Strategies

Contact us for an update on this or any trading strategy

The objective of this trading program is to participate in trends while defining risk on each trade and for the duration of every trading period.

Performance dates

2, January 1998 through  30, April 2015.
Net profit per $50,000 trading unit = +$422,641
Greatest net drawdown  =
-$10,480

Performance is based on trading one unit and deducting the net profits annually. Clearing and execution vary from firm to firm below I’m allowing 8 pips per round turn trade for bid/ask spreads and any potential order execution slippage.

Screenshot_300
Risk disclosure

2) Strategy

Let’s start by looking at the Eurodollar FX chart below is it really that hard to define the overall trend for this market during the last 12 months and the current reversal?

Click here to enlarge the chart below
Click here for a current chart

Screenshot_285

Once the trend is identified we employ strategies that define risk on every trade and for the duration of every trading period without wasting inordinate amounts of precious investment capital on purchasing option time premium.

3) Methods used

A) Option collars
B) Writing at the money, buying out of the money options against the trend
C) Writing deep in the money, buying out of the money options with the trend

4) Option collars

A) Establish you position with the trend in this example we’re long
B) B
uy an out of the money put to define risk
C) Write an out of the money call collecting premium to pay for the put

If the trend continues the long position will be called away at a profit
If the trend reverses the risk is defined by the purchased put
If the market stays the same you have not wasted money on time premium.

Click here to enlarge the chart below
Click here for a current chart

Screenshot_293

5) Collar Definition

Establishing a collar to protect a long position involves purchasing puts for downside insurance, while at the same time selling calls, with the premium taken to finance the cost of the puts.

The purchased puts will have a strike price the same or less than that of the calls sold, and very commonly both options are out-of-the-money when the position is established. The short calls will limit upside profit potential of the position for the duration of the option.

Collars can always be liquidated to lock in profits and then reestablished at the current level allowing additional gains while defining risk.

The degree to which the collar’s protective puts are paid for by the premium received from the written calls depends entirely on the current level of the underlying currency, the strike prices and premium amounts of the contracts chosen. It is possible to construct a collar so that not only are the puts fully paid for by the call premium, but that the call premium actually exceeds the puts’ cost. In other words the whole position may established at a net credit, which the collar investor keeps whether the level of the underlying currency increases, decreases or remains unchanged.

6) Benefits of using a “Collar”

A) The position cannot be stopped out regardless of market volatility
B) If you are correct in identifying the trend the trade will be profitable
C) Risk is objectively defined on the trade and for the duration of the trading period (expiration)
E) Collar’s can be lifted any time locking in gains and reestablished to capture more of the move
F) Trade frequency is defined for the duration of the trading period (expiration)
G) The only way the position can be called away is at a profit
H) If the market stays the same the call premium collected covers most if not all the put premium paid

7) Writing at the money options buying out of the money options against the trend creating a credit. In this example we’re anticipating the market moving higher. 

A) Write an at the money put collecting ” fat option time premium” .

B) Using a portion of the collected premium buy an out of the money put to define risk.

C) If the market continues its uptrend both puts will expire worthless generating a net credit for the account.

D) If the market reverses risk is defined by the purchased put with the loss being in part offset by the differences in option premium. 

Click here to enlarge this chart
Click here for a current chart

Defined

In options trading, an option spread is created by the simultaneous purchase and sale of options of the same currency but with different strike prices.

Any spread that is constructed using calls can be referred to as a call spread. Similarly, put spreads are spreads created using put options.

Option buyers can use spreads to define risk and profit on any trade and for the duration of the trading period.

Using this strategy premiums received from the short leg(s) of the spread are greater than the premiums paid for the long leg(s), resulting in funds being credited into the option trader’s account when the position is entered.

The net credit received is also the maximum profit attainable when implementing this spread strategy.

Benefits

A) The position cannot be stopped out regardless of market volatility
B) If  you identify the trend correctly the position will be profitable
C) Risk is objectively defined on the trade and for the duration of the trading period (expiration)
D) The spread can be lifted at any time to lock in gains and reestablished with defined risk
E) Trade frequency is defined for the duration of the trading period (expiration)
F) If the market stays the same with the trend continuing the premium collected generates a net credit to the account.

8) Writing deep in the money options buying out of the money options with the trend, in the example below the short term trend is higher.

A) Write an in the money put collecting “in the money” and “time premium

B) Using a portion of the collected premium purchase an out of the money put to define risk

C) If the trend continues both puts will expire creating a net credit for the account, If the market reverses the loss will be contained by the purchased put.

Click here to enlarge the chart below
Click here for a current chart

Screenshot_2976

Defined

Long; we write a deep in the money put option collecting “in the money” and “time value”  then purchase an out out the money put with a portion of the money collected from the write to define risk with the expectation that the market will move higher and both options will expire worthless. Should the market move substantially lower the risk will be limited by the purchased “out of the money” put and risk is objectively defined on this trade and for the duration of the trading period (expiration)

Short; we write a deep in the money call option collecting “in the money” and “time value” then purchase an out of the money call to define risk with the expectation that the market will move lower and both call options will expire worthless creating a net credit. Should the market move substantially higher the risk is objectively defined by the purchased “out of the money”  call on the trade and for the duration of the trading period.

Benefits

A) The position cannot be stopped out regardless of market volatility
B) Risk is objectively defined on the trade and for the duration of the trading period (expiration)
C) The spread can be lifted at any time to lock in gains and reestablished with defined risk
D) Trade frequency is defined for the duration of the trading period (expiration)
E) If the market stays the same with the trend continuing the premium collected generates a net credit to the account.

Fees

Front load = 0.00%
Management fee = 0.00% to 2.00% annually dependent on account size
Incentive fee = 10% to 20% of net new high profits quarterly
Recommended minimum = $50,000 or equivalent major currency,
Minimum $25,000 in
actual funds $25,000 notional funds.
Positions and liquidation value are available online at anytime.
Accounts can be funded and maintained in any major currency
Liquidity in portion or all 2-48 hours in any major currency.

Click here to open an account

If you have any questions or need additional information contract us

——————————————————————————————————————————————

RISK DISCLOSURE STATEMENT

PAST RESULTS ARE NOT NECESSARILY INDICATIVE OF FUTURE RESULTS. EXAMPLES OF HISTORIC PRICE MOVES OR EXTREME MARKET CONDITIONS ARE NOT MEANT TO IMPLY THAT SUCH MOVES OR CONDITIONS ARE COMMON OCCURRENCES OR ARE LIKELY TO OCCUR.

HYPOTHETICAL PERFORMANCE RESULTS HAVE MANY INHERENT LIMITATIONS, SOME OF WHICH ARE DESCRIBED BELOW. NO REPRESENTATION IS BEING MADE THAT ANY ACCOUNT WILL OR IS LIKELY TO ACHIEVE PROFITS OR LOSSES SIMILAR TO THOSE SHOWN IN FACT, THERE ARE FREQUENTLY SHARP DIFFERENCES BETWEEN HYPOTHETICAL PERFORMANCE RESULTS AND THE ACTUAL RESULTS SUBSEQUENTLY ACHIEVED BY ANY PARTICULAR TRADING PROGRAM. ONE OF THE LIMITATIONS OF HYPOTHETICAL PERFORMANCE RESULTS IS THAT THEY ARE GENERALLY PREPARED WITH THE BENEFIT OF HINDSIGHT.

IN ADDITION, HYPOTHETICAL TRADING DOES NOT INVOLVE FINANCIAL RISK, AND NO HYPOTHETICAL TRADING RECORD CAN COMPLETELY ACCOUNT FOR THE IMPACT OF FINANCIAL RISK IN ACTUAL TRADING. FOR EXAMPLE, THE ABILITY TO WITHSTAND LOSSES OR TO ADHERE TO A PARTICULAR TRADING PROGRAM IN SPITE OF TRADING LOSSES ARE MATERIAL POINTS WHICH CAN ALSO ADVERSELY AFFECT ACTUAL TRADING RESULTS. THERE ARE NUMEROUS OTHER FACTORS RELATED TO THE MARKETS IN GENERAL OR TO THE IMPLEMENTATION OF ANY SPECIFIC TRADE PROGRAM WHICH CANNOT BE FULLY ACCOUNTED FOR IN THE PREPARATION OF THE HYPOTHETICAL PERFORMANCE RESULTS AND ALL OF WHICH CAN ADVERSELY AFFECT ACTUAL TRADING RESULTS.

BID/ASK SPREADS, BROKERAGE COMMISSION, CLEARING, EXCHANGE AND REGULATORY FEES WILL HAVE AN ADVERSE IMPACT ON THE NET OVERALL PERFORMANCE OF YOUR ACCOUNT. PRIOR TO MAKING A DECISION TO PARTICIPATE IN ANY INVESTMENT MAKE SURE YOU FULLY UNDERSTAND THE FEES ASSOCIATED WITH TRADING.

THE INFORMATION PROVIDED IN THIS REPORT CONTAINS RESEARCH, MARKET COMMENTARY AND TRADE RECOMMENDATIONS. YOU MAY BE SOLICITED FOR AN ACCOUNT BY ONE OF OUR REPRESENTATIVES OR EMPLOYEES. IT SHOULD BE KNOWN THAT THE REPRESENTATIVES OF OUR FIRM MAY TRADE FUTURES AND OPTIONS FOR THEIR OWN ACCOUNTS OR THOSE OF OTHERS. DUE TO VARIOUS FACTORS (SUCH AS MARGIN REQUIREMENTS, RISK FACTORS, TRADING OBJECTIVES, TRADING INSTRUCTIONS, TRADING STRATEGIES, AND OTHER FACTORS) SUCH TRADING MAY RESULT IN THE LIQUIDATION OR INITIATION OF FUTURES OR OPTIONS POSITIONS THAT DIFFER FROM THE OPINIONS AND RECOMMENDATIONS FOUND IN THIS REPORT.

PAST PERFORMANCE IS NOT NECESSARILY INDICATIVE OF FUTURE PERFORMANCE. THE RISK OF LOSS IN TRADING FUTURES CONTRACTS OR COMMODITY OPTIONS CAN BE SUBSTANTIAL, AND THEREFORE INVESTORS SHOULD UNDERSTAND THE RISKS INVOLVED IN TAKING LEVERAGED POSITIONS AND MUST ASSUME RESPONSIBILITY FOR THE RISKS ASSOCIATED WITH SUCH INVESTMENTS AND FOR THEIR RESULTS.

YOU SHOULD CAREFULLY CONSIDER WHETHER SUCH TRADING IS SUITABLE FOR YOU IN LIGHT OF YOUR CIRCUMSTANCES AND FINANCIAL RESOURCES

My current date/time September 10, 2026 2:31 pm

Peter Knight

Direct 24/7 +1-340-244-4310

Member firms 
Schedule an online review

Email: Peter_Knight@PeterKnightAdvisor.com
GoTo VOIP number +1-312-450-0609

Address
Little Mountain Road,

Tortola
British Virgin Islands VG1110
BVI Location Google Map

18° 24′ 0″ N / 64° 36′ 0″ W

Frequently Asked Questions About the British Virgin Islands

Airport
Marinas
Corporate Law
Corporation Formation
Taxation
Real Estate Prices

Aerial of the Islands

Final approach, Beef Island, British Virgin Islands 

____________________________________________________________________

Disclosure

3 Month Deposit Rate, How It’s Set & History

3 month rates or Eurodollar deposits, are time deposits denominated in U.S. dollars at banks outside the United States. (There is no connection with the euro currency or the Eurozone). The term was originally coined for U.S. dollars deposited in European banks, but its expanded over the years to its present definition—a U.S. dollar-denominated deposit in any non US bank for example Tokyo or Beijing would be deemed a Eurodollar deposit.

Below is is 1992-2015 rate, price, contract valuation chart
Rate is in vertical column 1, contract price 2, contract value 3.
Each 0.01 move in this rate equals a $25 change in the contract’s value.
Example, a rate of 0.20% = a contract value of $500, at 0.40% the contract value would increase to $1,000

Click here
for charts, quotes and historical data from the Federal Reserve

Click here to enlarge the chart below

Screenshot_249

To capture the move you need to trade the underlying futures contract 

1)  Contract information and specifications
2)  The Exchange this contract is traded on
3)  Contract volume and open interest for all deliveries 2016 to 2026
4)  Quotes for all deliveries from 2016 through 2026

To convert the contract price into the rate it represents
Take 100.0000 –  the contract price = the rate, for example
100.0000 – a contract price of 99.7500 = a rate of 0.25%
100.0000 – a contract price of 99.5000 = a rate of 0.50%

To convert rate into contract value
Each 0.0100 change in price = $25,
1 full point 1.0000 = $2,500 for example
A rate of 0.25% X $2,500 = $625
A rate of 0.50% X $2,500 = $1,250

Trading this rate higher requires establishing a short position in the underlying futures contract, as the rate rises the futures contract falls in price to reflect the increase in rate/contract value, for example

99.7500 = a rate of 0.25%, contract value of $625
99.5000 = a rate of 0.50%, contract value of $1,250

Click here to enlarge the 1992-2014 monthly rate, price, valuation chart
Click here for a current chart

Screenshot_250

History of this rate

Gradually, after World War II, the quantity of U.S. dollars outside the United States increased enormously, as a result of both the Marshall Plan and imports into the U.S., which had become the largest consumer market after World War II.

As a result, enormous sums of U.S. dollars were in the custody of foreign banks outside the United States. Some foreign countries, including the Soviet Union, also had deposits in U.S. dollars in American banks, granted by certificates. Various history myths exist for the first Eurodollar creation, or booking, but most trace back to Communist governments keeping dollar deposits abroad.

In one version, the first booking traces back to Communist China, which, in 1949, managed to move almost all of its U.S. dollars to the Soviet-owned Banque Commerciale pour l’Europe du Nord in Paris before the United States froze the remaining assets during the Korean War.

In another version, the first booking traces back to the Soviet Union during the Cold War period, especially after the invasion of Hungary in 1956, as the Soviet Union feared that its deposits in North American banks would be frozen as a retaliation. It decided to move some of its holdings to the Moscow Narodny Bank, a Soviet-owned bank with a British charter. The British bank would then deposit that money in the US banks. There would be no chance of confiscating that money, because it belonged to the British bank and not directly to the Soviets. On 28 February 1957, the sum of $800,000 was transferred, creating the first eurodollars. Initially dubbed “Eurbank dollars” after the bank’s telex address, they eventually became known as “eurodollars” as such deposits were at first held mostly by European banks and financial institutions. A major role was played by City of London banks, as the Midland Bank, now HSBC, and their offshore holding companies.

In the mid-1950s, Eurodollar trading and its development into a dominant world currency began when the Soviet Union wanted better interest rates on their Eurodollars and convinced an Italian banking cartel to give them more interest than what could have been earned if the dollars were deposited in the U.S. The Italian bankers then had to find customers ready to borrow the Soviet dollars and pay above the U.S. legal interest-rate caps for their use, and were able to do so; thus, Eurodollars began to be used increasingly in global finance.

Eurodollars can have a higher interest rate attached to them because of the fact that they are out of reach from the Federal Reserve. U.S. banks hold an account at the Fed and can, ostensibly, receive unlimited liquidity from the Fed should any trouble arise. These required reserves and Fed backing make U.S. Dollar deposits in U.S. banks inherently less risky, and Eurodollar deposits slightly more risky, which requires a slightly higher interest rate.

By the end of 1970 385,000M eurodollars were booked offshore. These deposits were lent on as US dollar loans to businesses in other countries where interest rates on loans were perhaps much higher in the local currency, and where the businesses were exporting to the USA and being paid in dollars, thereby avoiding foreign exchange risk on their loans.

Several factors led Eurodollars to overtake certificates of deposit (CDs) issued by U.S. banks as the primary private short-term money market instruments by the 1980s, including:

  • The successive commercial deficits of the United States
  • The U.S. Federal Reserve’s ceiling on domestic deposits during the high inflation of the 1970s
  • Eurodollar deposits were a cheaper source of funds because they were free of reserve requirements and deposit insurance assessments

Market size

By December 1985 the Eurocurrency market was estimated by Morgan Guaranty bank to have a net size of 1,668B, of which 75% are likely eurodollars. However, since the markets are not responsible to any government agency its growth is hard to estimate. The Eurodollar market is by a wide margin the largest source of global finance. In 1997, nearly 90% of all international loans were made this way

Futures contracts

The Eurodollar futures contract refers to the financial futures contract based upon these deposits, traded at the Chicago Mercantile Exchange (CME). More specifically, EuroDollar futures contracts are derivatives on the interest rate paid on those deposits. Eurodollars are cash settled futures contract whose price moves in response to the interest rate offered on US Dollar denominated deposits held in European banks. Eurodollar futures are a way for companies and banks to lock in an interest rate today, for money it intends to borrow or lend in the future. Each CME Eurodollar futures contract has a notional or “face value” of $1,000,000, though the leverage used in futures allows one contract to be traded with a margin of about one thousand dollars.

CME Eurodollar futures prices are determined by the market’s forecast of the 3-month USD LIBOR interest rate expected to prevail on the settlement date. A price of 95.00 implies an interest rate of 100.00 – 95.00, or 5%. The settlement price of a contract is defined to be 100.00 minus the official British Bankers’ Association fixing of 3-month LIBOR on the day the contract is settled.

How the Eurodollar futures contract works

For example, if on a particular day an investor buys a single three-month contract at 95.00 (implied settlement LIBOR of 5.00%):

  • if at the close of business on that day, the contract price has risen to 95.01 (implying a LIBOR decrease to 4.99%), US$25 will be paid into the investor’s margin account; or
  • if at the close of business on that day, the contract price has fallen to 94.99 (implying a LIBOR increase to 5.01%), US$25 will be deducted from the investor’s margin account.

On the settlement date, the settlement price is determined by the actual LIBOR fixing for that day rather than a market-determined contract price.

Futures Contract History

The Eurodollar futures contract was launched in 1981, as the first cash-settled futures contract. People reportedly camped out the night before the contract’s open, flooding the pit when the CME opened the doors. That trading pit was the largest pit ever, nearly the size of a football field, and quickly became one of the most active on the trading floor, with over 1500 traders and clerks coming to work every day on what was then known as the CME’s upper trading floor.  That floor is no longer, with the CME having moved over to the CBOT’s trading floor and 98% of Eurodollar trading now done electronically.

Eurodollar futures contract as synthetic loan

A single Eurodollar future is similar to a forward rate agreement to borrow or lend US$1,000,000 for three months starting on the contract settlement date. Buying the contract is equivalent to lending money, and selling the contract short is equivalent to borrowing money.

Consider an investor who agreed to lend US$1,000,000 on a particular date for three months at 5.00% per annum (months are calculated on a 30/360 basis). Interest received in 3 months’ time would be US$1,000,000 × 5.00% × 90 / 360 = US$12,500.

  • If the following day, the investor is able to lend money from the same start date at 5.01%, s/he would be able to earn US$1,000,000 × 5.01% × 90 / 360 = US$12,525 of interest. Since the investor only is earning US$12,500 of interest, s/he has lost US$25 as a result of interest rate moves.
  • On the other hand, if the following day, the investor is able to lend money from the same start date only at 4.99%, s/he would be able to earn only US$1,000,000 × 4.99% × 90 / 360 = US$12,475 of interest. Since the investor is in fact earning US$12,500 of interest, s/he has gained US$25 as a result of interest rate moves.

This demonstrates the similarity. However, the contract is also different from a loan in several important respects:

  • In an actual loan, the US$25 per basis point is earned or lost at the end of the three-month loan, not up front. That means that the profit or loss per 0.01% change in interest rate as of the start date of the loan (i.e., its present value) is less than US$25. Moreover, the present value change per 0.01% change in interest rate is higher in low interest rate environments and lower in high interest rate environments. This is to say that an actual loan has convexity. A Eurodollar future pays US$25 per 0.01% change in interest rate no matter what the interest rate environment, which means it does not have convexity. This is one reason that Eurodollar futures are not a perfect proxy for expected interest rates. This difference can be adjusted for by reference to the implied volatility of options on Eurodollar futures.
  • In an actual loan, the lender takes credit risk to a borrower. In Eurodollar futures, the principal of the loan is never disbursed, so the credit risk is only on the margin account balance. Moreover, even that risk is the risk of the clearinghouse, which is considerably lower than even unsecured single-A credit risk.

Other features of Eurodollar futures

40 quarterly expirations and 4 serial expirations are listed in the Eurodollar contract. This means that on 1 January 2011, the exchange will list 40 quarterly expirations (March, June, September, December for 2011 through 2020), the exchange will also list another four serial (monthly) expirations (January, February, April, May 2011). This extends tradeable contracts over ten years, which provides an excellent picture of the shape of the yield curve. The front month contracts are among the most liquid futures contracts in the world, with liquidity decreasing for the further out contracts. Total open interest for all contracts is typically over 10 million.

The CME Eurodollar futures contract is used to hedge interest rate swaps. There is an arbitrage relationship between the interest rate swap market, the forward rate agreement market and the Eurodollar contract. CME Eurodollar futures can be traded by implementing a spread strategy among multiple contracts to take advantage of movements in the forward curve for future pricing of interest rates.

In United States banking, Eurodollars are a popular option for what are known as “sweeps“. Until July 21, 2011, banks were not allowed to pay interest on corporate checking accounts. To accommodate larger businesses, banks may automatically transfer, or sweep, funds from a corporation’s checking account into an overnight investment option to effectively earn interest on those funds. Banks usually allow these funds to be swept either into money market mutual funds, or alternately they may be used for bank funding by transferring to an offshore branch of a bank.

If you have questions send us a message or schedule an online review .

Regards,
Peter Knight Advisor

—————————————————————-

Privacy Notice

Disclosure

x

What the Fed Funds rate is and how it’s set

In the United States, the federal funds rate is the interest rate at which institutions actively trade balances held at the Federal Reserve.

Click here to enlarge the chart below
Click here for a current chart and historical data

Screenshot_318

How Fed Funds Trade

Institutions with surplus balances in their accounts lend those balances to institutions in need of larger balances. The interest rate that the borrowing bank pays is negotiated between the two banks, and the weighted average of this rate across all such transactions is the federal funds effective rate.

The federal funds target rate is determined by a meeting of the members of the Federal Open Market Committee which normally occurs eight times a year about seven weeks apart. The committee may also hold additional meetings and implement target rate changes outside of its normal schedule.

Click here for the names of the individuals that determine rates.
Click here for the 12 regional Federal Reserve Banks and their presidents.
Click here for the F.O.M.C. meeting and post meeting press conference schedule.
Click here Bloomberg interactive Fed Funds rate chart.
Click here for the 1954-2013 Fed Funds rate chart and historical price data from the Federal Reserve

The Federal Reserve uses open market operations to influence the supply of money in the U.S. economy to make the federal funds effective rate follow the federal funds target rate.

U.S. banks and thrift institutions are obligated by law to maintain certain levels of reserves, either as reserves with the Fed or as vault cash. The level of these reserves is determined by the outstanding assets and liabilities of each depository institution, as well as by the Fed itself, but is typically 10% of the total value of the bank’s demand accounts (depending on bank size). In the range of $9.3 million to $43.9 million, for transaction deposits (checking accounts, NOWs, and other deposits that can be used to make payments) the reserve requirements are 3 percent of the end-of-the-day daily average amount held over a two-week period. Transaction deposits over $43.9 million held at the same depository institution are carried a 10 percent reserve requirement.

For example, assume a particular U.S. depository institution, in the normal course of business, issues a loan. This dispenses money and decreases the ratio of bank reserves to money loaned. If its reserve ratio drops below the legally required minimum, it must add to its reserves to remain compliant with Federal Reserve regulations. The bank can borrow the requisite funds from another bank that has a surplus in its account with the Fed. The interest rate that the borrowing bank pays to the lending bank is negotiated between the two banks and the weighted average of this rate across all such transactions is the federal funds effective rate.

The nominal rate is a target set by the governors of the Federal Reserve which they enforce primarily by open market operations. That nominal rate is almost always what is meant by the media referring to the Federal Reserve “changing interest rates.” The actual Fed funds rate generally lies within a range of that target rate, as the Federal Reserve cannot set an exact value through open market operations.

Another way banks can borrow funds to keep up their required reserves is by taking a loan from the Federal Reserve itself at the discount window. These loans are subject to audit by the Fed, and the discount rate is usually higher than the federal funds rate. Confusion between these two kinds of loans often leads to confusion between the federal funds rate and the discount rate. Another difference is that while the Fed cannot set an exact federal funds rate, it can set a specific discount rate.

The federal funds rate target is decided by the governors at Federal Open Market Committee (FOMC) meetings. The FOMC members will either increase, decrease, or leave the rate unchanged depending on the meeting’s agenda and the economic conditions of the U.S. It is possible to infer the market expectations of the FOMC decisions at future meetings from the Chicago Board of Trade (CBOT) Fed Funds futures contracts, and these probabilities are widely reported in the financial media.

Applications

Interbank borrowing is essentially a way for banks to quickly raise liquidity. For example, a bank may want to finance a major industrial effort but not have the time to wait for deposits or interest (on loan payments) to come in. In such cases the bank will quickly raise this amount from other banks at an interest rate equal to or higher than the Federal funds rate.

Raising the federal funds rate will dissuade banks from taking out such inter-bank loans, which in turn will make cash that much harder to procure. Conversely, dropping the interest rates will encourage banks to borrow money and therefore invest more freely. Thus this interest rate acts as a regulatory tool to control how freely the US economy operates.

By setting a higher discount rate the Federal Bank discourages banks from requisitioning funds from the Federal Bank, yet positions itself as a lender of last resort.

Comparison with LIBOR

Though the London Interbank Offered Rate (LIBOR) and the federal funds rate are concerned with the same action, i.e. interbank loans, they are distinct from one another, as follows:

  • The target federal funds rate is a target interest rate that is set by the FOMC for implementing U.S. monetary policies.
  • The (effective) federal funds rate is achieved through open market operations at the Domestic Trading Desk at the Federal Reserve Bank of New York which deals primarily in domestic securities (U.S. Treasury and federal agencies’ securities).
  • LIBOR is calculated from prevailing interest rates between highly credit-worthy institutions.
  • LIBOR may or may not be used to derive business terms. It is not fixed beforehand and is not meant to have macroeconomic ramifications.

If you have questions send us a message or schedule an online review .

Regards,
Peter Knight Advisor

—————————————————————-

Privacy Notice

Disclosure

x

RISK DISCLOSURE STATEMENT

RISK DISCLOSURE STATEMENT

PROGRAM AVAILABILITY IS DEPENDENT ON YOUR COUNTRY OF RESIDENCY AND FINANCIAL STATUS

PAST PERFORMANCE IS NOT NECESSARILY INDICATIVE OF FUTURE PERFORMANCE. THE RISK OF LOSS IN TRADING FOREX OR FUTURES CONTRACTS OR OPTIONS CAN BE SUBSTANTIAL, AND THEREFORE INVESTORS SHOULD UNDERSTAND THE RISKS INVOLVED IN TAKING LEVERAGED POSITIONS AND MUST ASSUME RESPONSIBILITY FOR THE RISKS ASSOCIATED WITH SUCH INVESTMENTS AND FOR THEIR RESULTS.

BID/ASK SPREADS, BROKERAGE COMMISSION, CLEARING, EXCHANGE AND REGULATORY FEES WILL HAVE AN ADVERSE IMPACT ON THE NET OVERALL PERFORMANCE OF YOUR ACCOUNT. PRIOR TO MAKING A DECISION TO PARTICIPATE IN ANY INVESTMENT MAKE SURE YOU FULLY UNDERSTAND THE FEES ASSOCIATED WITH TRADING.

EXAMPLES OF HISTORIC PRICE MOVES OR EXTREME MARKET CONDITIONS ARE NOT MEANT TO IMPLY THAT SUCH MOVES OR CONDITIONS ARE COMMON OCCURRENCES OR ARE LIKELY TO OCCUR.

HYPOTHETICAL PERFORMANCE RESULTS HAVE MANY INHERENT LIMITATIONS, SOME OF WHICH ARE DESCRIBED BELOW. NO REPRESENTATION IS BEING MADE THAT ANY ACCOUNT WILL OR IS LIKELY TO ACHIEVE PROFITS OR LOSSES SIMILAR TO THOSE SHOWN IN FACT, THERE ARE FREQUENTLY SHARP DIFFERENCES BETWEEN HYPOTHETICAL PERFORMANCE RESULTS AND THE ACTUAL RESULTS SUBSEQUENTLY ACHIEVED BY ANY PARTICULAR TRADING PROGRAM. ONE OF THE LIMITATIONS OF HYPOTHETICAL PERFORMANCE RESULTS IS THAT THEY ARE GENERALLY PREPARED WITH THE BENEFIT OF HINDSIGHT.

IN ADDITION, HYPOTHETICAL TRADING DOES NOT INVOLVE FINANCIAL RISK, AND NO HYPOTHETICAL TRADING RECORD CAN COMPLETELY ACCOUNT FOR THE IMPACT OF FINANCIAL RISK IN ACTUAL TRADING. FOR EXAMPLE, THE ABILITY TO WITHSTAND LOSSES OR TO ADHERE TO A PARTICULAR TRADING PROGRAM IN SPITE OF TRADING LOSSES ARE MATERIAL POINTS WHICH CAN ALSO ADVERSELY AFFECT ACTUAL TRADING RESULTS. THERE ARE NUMEROUS OTHER FACTORS RELATED TO THE MARKETS IN GENERAL OR TO THE IMPLEMENTATION OF ANY SPECIFIC TRADE PROGRAM WHICH CANNOT BE FULLY ACCOUNTED FOR IN THE PREPARATION OF THE HYPOTHETICAL PERFORMANCE RESULTS AND ALL OF WHICH CAN ADVERSELY AFFECT ACTUAL TRADING RESULTS.

YOU SHOULD CAREFULLY CONSIDER WHETHER SUCH TRADING IS SUITABLE FOR YOU IN LIGHT OF YOUR CIRCUMSTANCES AND FINANCIAL RESOURCES.

THE INFORMATION PROVIDED IN THIS REPORT CONTAINS RESEARCH, MARKET COMMENTARY AND TRADE RECOMMENDATIONS. YOU MAY BE SOLICITED FOR AN ACCOUNT BY ONE OF OUR REPRESENTATIVES OR EMPLOYEES. IT SHOULD BE KNOWN THAT THE REPRESENTATIVES OF OUR FIRM MAY TRADE FUTURES AND OPTIONS FOR THEIR OWN ACCOUNTS OR THOSE OF OTHERS. DUE TO VARIOUS FACTORS (SUCH AS MARGIN REQUIREMENTS, RISK FACTORS, TRADING OBJECTIVES, TRADING INSTRUCTIONS, TRADING STRATEGIES, AND OTHER FACTORS) SUCH TRADING MAY RESULT IN THE LIQUIDATION OR INITIATION OF FUTURES OR OPTIONS POSITIONS THAT DIFFER FROM THE OPINIONS AND RECOMMENDATIONS FOUND IN THIS REPORT.

Member Firms – FSS

1) Clearing and Exchange Members
2) 126 billion Financial Safeguard System Performance Bond
Click here for contact details

x


RISK DISCLOSURE STATEMENT

PROGRAM AVAILABILITY IS DEPENDENT ON YOUR COUNTRY OF RESIDENCY AND FINANCIAL STATUS

PAST RESULTS ARE NOT NECESSARILY INDICATIVE OF FUTURE RESULTS. EXAMPLES OF HISTORIC PRICE MOVES OR EXTREME MARKET CONDITIONS ARE NOT MEANT TO IMPLY THAT SUCH MOVES OR CONDITIONS ARE COMMON OCCURRENCES OR ARE LIKELY TO OCCUR.

HYPOTHETICAL PERFORMANCE RESULTS HAVE MANY INHERENT LIMITATIONS, SOME OF WHICH ARE DESCRIBED BELOW. NO REPRESENTATION IS BEING MADE THAT ANY ACCOUNT WILL OR IS LIKELY TO ACHIEVE PROFITS OR LOSSES SIMILAR TO THOSE SHOWN IN FACT, THERE ARE FREQUENTLY SHARP DIFFERENCES BETWEEN HYPOTHETICAL PERFORMANCE RESULTS AND THE ACTUAL RESULTS SUBSEQUENTLY ACHIEVED BY ANY PARTICULAR TRADING PROGRAM. ONE OF THE LIMITATIONS OF HYPOTHETICAL PERFORMANCE RESULTS IS THAT THEY ARE GENERALLY PREPARED WITH THE BENEFIT OF HINDSIGHT.

IN ADDITION, HYPOTHETICAL TRADING DOES NOT INVOLVE FINANCIAL RISK, AND NO HYPOTHETICAL TRADING RECORD CAN COMPLETELY ACCOUNT FOR THE IMPACT OF FINANCIAL RISK IN ACTUAL TRADING. FOR EXAMPLE, THE ABILITY TO WITHSTAND LOSSES OR TO ADHERE TO A PARTICULAR TRADING PROGRAM IN SPITE OF TRADING LOSSES ARE MATERIAL POINTS WHICH CAN ALSO ADVERSELY AFFECT ACTUAL TRADING RESULTS. THERE ARE NUMEROUS OTHER FACTORS RELATED TO THE MARKETS IN GENERAL OR TO THE IMPLEMENTATION OF ANY SPECIFIC TRADE PROGRAM WHICH CANNOT BE FULLY ACCOUNTED FOR IN THE PREPARATION OF THE HYPOTHETICAL PERFORMANCE RESULTS AND ALL OF WHICH CAN ADVERSELY AFFECT ACTUAL TRADING RESULTS.

BID/ASK SPREADS, BROKERAGE COMMISSION, CLEARING, EXCHANGE AND REGULATORY FEES WILL HAVE AN ADVERSE IMPACT ON THE NET OVERALL PERFORMANCE OF YOUR ACCOUNT. PRIOR TO MAKING A DECISION TO PARTICIPATE IN ANY INVESTMENT MAKE SURE YOU FULLY UNDERSTAND THE FEES ASSOCIATED WITH TRADING.

THE INFORMATION PROVIDED IN THIS REPORT CONTAINS RESEARCH, MARKET COMMENTARY AND TRADE RECOMMENDATIONS. YOU MAY BE SOLICITED FOR AN ACCOUNT BY ONE OF OUR REPRESENTATIVES OR EMPLOYEES. IT SHOULD BE KNOWN THAT THE REPRESENTATIVES OF OUR FIRM MAY TRADE FUTURES AND OPTIONS FOR THEIR OWN ACCOUNTS OR THOSE OF OTHERS. DUE TO VARIOUS FACTORS (SUCH AS MARGIN REQUIREMENTS, RISK FACTORS, TRADING OBJECTIVES, TRADING INSTRUCTIONS, TRADING STRATEGIES, AND OTHER FACTORS) SUCH TRADING MAY RESULT IN THE LIQUIDATION OR INITIATION OF FUTURES OR OPTIONS POSITIONS THAT DIFFER FROM THE OPINIONS AND RECOMMENDATIONS FOUND IN THIS REPORT.

PAST PERFORMANCE IS NOT NECESSARILY INDICATIVE OF FUTURE PERFORMANCE. THE RISK OF LOSS IN TRADING FUTURES CONTRACTS OR COMMODITY OPTIONS CAN BE SUBSTANTIAL, AND THEREFORE INVESTORS SHOULD UNDERSTAND THE RISKS INVOLVED IN TAKING LEVERAGED POSITIONS AND MUST ASSUME RESPONSIBILITY FOR THE RISKS ASSOCIATED WITH SUCH INVESTMENTS AND FOR THEIR RESULTS.

YOU SHOULD CAREFULLY CONSIDER WHETHER SUCH TRADING IS SUITABLE FOR YOU IN LIGHT OF YOUR CIRCUMSTANCES AND FINANCIAL RESOURCES.

Energy Analysis

1) Whats Moving

US Energy Futures
Non US Energy Futures
1 Month 1 Month
3 Month 3 Month
This Year This Year
12 Month 12 Month

2) Buy, Sell Hold Summary

US Energy Futures
Non US Energy Futures

3) Energy Futures Analysis

Link Analysis Page 2 Hour Daily Weekly Opinion
3.1 Crude WTI Chart Chart Chart Opinion
3.2 Crude Brent Chart Chart Chart Opinion
3.3 Heating Oil Chart Chart Chart Opinion
3.4 Gasoline Chart Chart Chart Opinion
3.5 Natural Gas Chart Chart Chart Opinion
3.6 Quotes US Europe CB-CL GC/CL

4) Educational

General Information on Future and Futures Options

4.1) Futures Educational Videos (60)
4.2) Futures Options Educational Videos (34)

5) Energy Futures & Options Videos

5.1) Fundamentals and Energy Futures
5.2) Discover WTI: A Global Benchmark
5.3)
Understanding Crude Oil in the United States
5.4) Introduction to European Crude Oil
5.5)
Learn about Crude Oil Across Asia Region
5.6) Crude Oil Futures versus ETFs
5.7) The Benefits of Liquidity
5.8)
Understanding the Oil Data Report
5.9) A Look into the Refining Process
5.10)
Learn about the 1:1 Crack Spread
5.11) The Importance of Cushing, Oklahoma
5.12)
U.S. Resurgence in Global Crude Oil Production
5.13)Managing Risk in the Energy Market
5.14)
Trading Insight for Options on Crude Oil and Natural Gas
5.15)Revisiting the WTI-Brent Crude Oil Spread
5.16) Introduction to Natural Gas
5.17) Understanding Supply and Demand: Natural Gas
5.18) Introduction to Natural Gas Seasonality
5.19) Understanding Natural Gas Risk Management Spreads
5.20) Understanding the Henry Hub
5.21) Natural Gas Calendar Spread Options
5.22) About Heating Oil Futures

6) Energy Futures & Options Reports

6.1) Worldwide Oil – WTI / Brent Spread
6.2) Refining 101 – Understanding Crack Spreads
6.3) Natural Gas in a Producing Revolution
6.4) Crude Oil and Its Refined Products
6.5) Oil: How the Market Dynamics Have Changed
6.6) Trading the Curve in Energies
6.7) U.S. the Largest Crude Oil Producer
6.8) Surging U.S. Domestic Crude Grades Market
6.9) Are Crude Oil & Natural Gas Prices Linked?
6.10) WTI and the Changing Dynamics of Global Crude
6.11) Oil Traders Sell on the Rumor and Buy on the News
6.12) Veg Oil vs. Crude Oil: Tail Wagging the Dog?
6.13) Is Crude Oil Taking Cue from Vegetable Oils?
6.13) Natural Gas in a Producing Revolution

7) Exchanges

7.1) Chicago Mercantile Exchange (CME)
7.2) Eurex
7.3) Intercontinental (ICE)
7.4) US Rate Analysis Page
7.5) European Rate Analysis Page

8) Program Structure and Account Opening Procedure

8.1) ATA’s, What They Are and How They Work
8.2) The ATA Fee Structure
8.3) Defining Overall Risk For Your ATA Account

8.4) Exchanges Traded
8.5) Brokerage Firms
8.6) How Balances Are Guaranteed Plus or Minus Trading
8.7)
How To Open An Account

If you have questions send us a message or schedule an online review .

Regards,
Peter Knight Advisor

—————————————————————-

Privacy Notice

Disclosure