
1) Federal debt has gown 5 times faster than revenue.
Growth in Federal revenue from 1981 to 2023 +679.79%
Growth in Federal debt from 1981 to 2023 +3,284.32%,
Annual Federal revenue as a percentage of total Federal debt has fallen from 60.26% in 1981 to 12.94% in 2023 if rates rose to the levels we saw from 1978 through 1985, 100% of total Federal Revenue would be consumed by debt service cost alone.
1981 60.26%
2008 25.28%
2023 12.94%

Chronology of U.S. debt
15th of August 1971 Richard Nixon “temporarily” took the USD off the gold standard which enabled politicians to create and spend nearly any amount of money at will, when you listen to Nixon’s rhetoric I’m surprised it took another two years to impeach him.
From 1971 through 1980 Federal debt increased from 424.27 billion to 909.04 billion, reported inflation from 4.35% to 14.60%.

In 1980 politicians had two choices,
1) To real in deficit spending, balance budgets and impliment responsible fiscal policy which would have contained inflation, earned back the open market’s trust and enabled the Federal Government to finance deficit spending in the open market.
2) To revise the way inflation was calculated this would immediately contain it without making any of the the necessary spending cuts and if the markt bought the revised inflation numbers it would contain debt service cost and potentially make U.S. Treasuries attractive enough to find bids on the open market.
They chose 2 and instructed the BLS.GOV to come up with a solution, the BLS.GOV did and Hedonic Quality Adjustments were born. in short if a car went from 50K to 75K prior to Hedonic Quality Adjustments the increase in price would have been 50%, post Hedonic Quality Adjustments if the same car went from 50K to 75K because the car according to the BLS.GOV is now of a higher quality and is going to last twice as long according to the BLS.GOV it’s gone down in price. See Inflation – Perception versus Reality, for more on how inflation has been twisted since 1981 to accommodate the U.S. Treasury.
The market saw through Hedonic Quality Adjustments, their purpose and dramatically reduced purchases of U.S. Treasuries to the extent the majority of all U.S. Treasury debt hitting the market did not find buyers.
Rather than fix the problem starting in 1981 though today the Federal Government has literally cleaned out all 6.743 trillion paid into evey Federal agency and Trust. The mandatory deposits made by the beneficiaries of these Trusts have had their hard earned dollars repla ced with special issues , special issues are nothing more then non marketable government IOUs. This decision to dump debt into these Trusts at non competitive rates is the major reason for their estimated insolvency before 2031

Unfortunately cleaning out all the Federal Agency and trusts wasn’t enough to satiate the spending appetites of politicians, multiple bad trade deals were cut the resulting trade deficits removed 14.26 trillion in wealth from thr United States, of which non U.S. investors rolled 7.318 trillion dollars into Treasuries, this supported the dollar, enabled U.S. consumers to continue to borrow and buy from foreign manufacturers, US. manufacturers unable to compete were decimated.

Fed
Banks
In 2023 there are no buyers for the trillions in maturing debt that needs to be reissued nor the trillions in new debt that need to be sold. that’s rated below Hong Kong, Taiwan, Finland,
does not have the ability to service their existing debt much less find buyers for trillions in new debt. that’s now rated below Hong Kong, Taiwan, Finland and pays less than the 12 month average of their questionable inflation rate
2) Historical debt ratios
1981
-
- Federal Debt 995 billion,
- Annual Federal revenue 559 billion
- Money Supply M1 390 billion
- Federal debt service cost 14.31% 142.40 billion
- 142.40 billion consumed 23.76% of total Federal revenue.
- Annual Federal revenue as a percentage of total Federal Debt 60.24%
- U.S. Debt rating AAA stable
2008
-
- Federal Debt 9.986 trillion,
- Annual Federal revenue 2.539 trillion
- Money Supply M1 1.37 trillion
- Federal debt service cost 3.49%, 348 billion
- 348 billion consumed 13.80% of total Federal revenue.
- Annual Federal revenue as a percentage of total Federal Debt 25.28%
- U.S. Debt rating AAA stable
2023
-
- Federal Debt 32.619 trillion,
- Annual Federal revenue 4.359 trillion
- Money Supply M1 18.506 trillion
- Rate the U.S. Treasury is paying on total Federal debt 3.28%
- Federal debt service cost at 3.28%, 1.104 trillion dollars
- 1.104 trillion consumes 25.34% of total Federal revenue.
- U.S. Debt rating AA+ Negative with further debt downgrades expected
- Current average Treasury rate 5.11%
- Debt service cost at 5.11%,1.717 trillion which would consume 39.39% of total revenue
- 2023 Federal revenue as a percent of total Federal debt is 12.94%
- Federal Debt 32.619 trillion,
3) In 2023 the U.S will be spending 287 billion more on debt service than defense.
-
- Defense budget 816.7 billion
- Total debt service cost 1.104 trillion

Federal debt December 2007, 8.95 trillion,
Federal debt estimate December 2023 33.48 trillion +24.53 trillion or +274.07%,
Federal revenue 2008, 2.567 trillion.
Federal revenue estimate December 2023 4.359 trillion +69.80%.
4) Deficit spending of 24.53 trillion since 2008? In 2023 USD that’s 5 times the fiscal cost of WW II, 23 times the cost of FDR’s New Deal the New Deal was FDR’s stimulus program that employed 4 million citizens, built America’s infrastructure, prepared the U.S for World War 2 and lifted the U.S. out of the Great Depression. Over the last 15 years, 24.53 trillion, can you name one thing in the United States that is better in 2023 than 2008?
5) Over the next 12 months the U.S has 4+ trillion in maturing debt that needs to be refinanced, 2+ trillion in new debt that needs to be sold, they’re going try and sell this record 6+ trillion dollars in debt on the open market (not to the Federal Reserve or Federal Agencies and Trusts) this debt has a rating below Taiwan, Hong Kong and Finland and paysan average of 1.63% below the 12 month average of their reported inflation rate of 6.30%,
6) What it took to attract buyers for U.S. debt during the 37 years before quantitative easing was a debt rating of AAA stable paying an average of 8.70%, or 3.99% above more accurately reported inflation of 4.71%, even with these stellar numbers the U.S. couldn’t find enough bids.

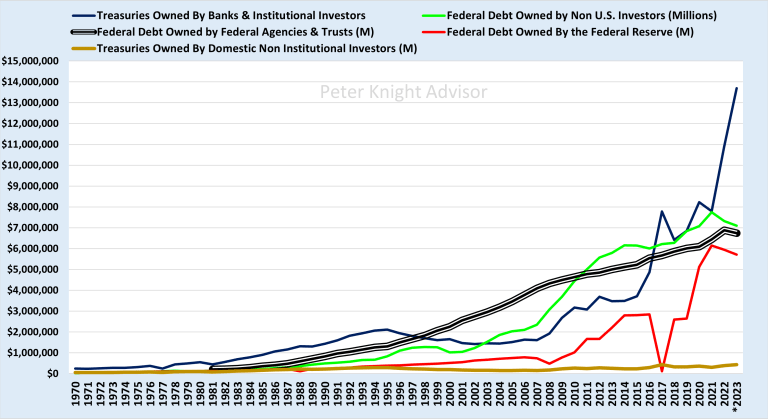
7) From 1970 through 2007 net sales a Federal debt totaled 8.861 trillion of the 8.861 trillion only 2.54 trillion was sold to domestic buyers on the open market, 2.23 trillion was purchased by non-us investors using trade deficit proceeds, the remaining 4.09 trillion couldn’t find bids and was dumped into Federal agency and Trust accounts like Social Security, Military and Civilian pensions all at non competitive rates, this was the beginning of the end for these Trusts.
8) Who is going to buy this 6+ trillion of U.S. debt with a rating below Taiwan, Hong Kong and Finland paying 1.63% below the 12 month average of their reported inflation of 6.30%.?
9) Domestic non institutional investors? No, it would be a little challenging for them to cover this 6+ trillion over the next 12 months with 1.515 trillion in total assets that could be used to purchase this downgraded treasury debt, you have to remember domestic non institutional investors can’t create trillions with keypunch entries like the Federal Reserve or U.S. banks. .

10) Federal Agency and Trust accounts? No,
Since 1987 Social Security Military and Civilian Pensions funds have been cleaned out as quickly as the beneficiaries made their mandatory payments of 6.20% to 12.40% into them. Since 1987 the Federal Government has “borrowed” all the money out of these Trusts and dumped (non marketable “special issue” Federal debt) into them paying non competitive rates, this is the cause of their projected insolvency before 2031

11) Banks? No,
As big of problem is the expansion in money supply M1 from 1.38 trillion in 2008 to 18.49 trillion in 2023 this tells you banks are using far more leverage in 2023 than 2008 and the severity of the Federal debt, banking and mortgage crisis on deck is multiple times what we saw in 2008, for starters compare total assets for current bank failures to the 465 bank failures between 2008-2012 then total Fed bailouts from 2008-2012 of 926 billion.
In 2023 unrealized loses for banks just on their treasury positions alone now exceeds 1.74 trillion, 360 billion more than total money supply in 2008. Prior to banking and mortgage crisis last time round home prices fell from $257,400 in January 2007 to $238,400 by December 2007 -7.97%. This time round we’ve seen them fall from $479,500 January 2023 to $416,000 in June 2023 down -13.22% for a percentage loss of nearly twice as much in half the time. ??
The Fed’s fund rate is now averaging 5.08%, SOFR 5.05%, average Treasury rate 5.11%. The borrow from the Fed and deposit into treasury spread is gone, it went from paying an average of 1.86% to 0.03%,heavy bank speculation in this spread will be one of the main causes of the next banking crisis..
The last time we had the Fed funds rate at or above the Treasury rate was 2007, the banking crisis fully engaged by 2008, by 2012 465 banks had failed.

2008-2022 Fed Funds versus the 5 Year

12) Short-term borrowing costs have more than tripled, liquidation value of the 5 year has fallen from 126 to 106 -15.87%, see this chart banks that are in these trades and didn’t adequately hedge risk are getting hammered, it’s a safe bet Silicon Valley, Signature and First Republic are just the tip of the iceberg.

13) In March of 2020 the Federal Reserve ended the 10% bank reserve requirement essentially enabling banks to create nearly any amount of money to do anything with, this spiked money supply M1 from 4,261 to 20.664 trillion, the majority of this M1 increase found its way to Wall Street not Main Street, this video explains the impact.
14) Hundreds of banks now have their book loaded with HTM (hold to maturity) HTMs enable the bank to value the position closer to the face value rather than liquidation value, if banks had to realize the loss now or accurately report their unrealized loss it could impact their capital requirements and shut them down. .
Fed article The Implications of Unrealized Losses for Banks,pdf
More on hedging issues by the Fed The Misleading Notion of Notionals
In 2023 unrealized loses for banks just on their treasury positions now exceeds 1.74 trillion, 360 billion more than total money supply in 2008 when 465 banks failed from being over leveraged again, total money supply M1 in 2008 was 1.38 trillion unrealized losses for banks in 2023, 1.74 trillion with total money supply M1 at 18.49 trillion.

The only thing that will save these 200+ banks is if the Fed Funds rate drops from 5.09% to below 2.50%, by March 2024 if not you can add them to the Silicon Valley, Signature and First Republic failed bank list.
15) Foreign buyers, No,
The 14 trillion dollar trade deficit beneficiaries, who bought 5.311 trillion between 2008 and 2021 turned big sellers in 2022, their net holdings of Treasuries from the 2021 high including unrealized profit or loss has declined by 1.933 trillion, this gives you a pretty good idea what they think about current U.S. monetary policy, the Federal Reserve and the outlook for the U.S. economy.

16) The only option left for the U.S. is to let their banking crisis engage, another crisis will give them the justification they need for the Federal Reserve to fire up the Quantitative Easing printing press and buy trillions more in bad bank debt, while behind the scenes they buy twice as much Treasury debt all at non competitive rates like they have since 2008.
17) From 2008 though 2022 the Federal reserve created over 8 trillion dollars with keypunch entries of the 8+ trillion 2.517 trillion was used to buy bad bank debt, 5.713 trillion was used to buy treasuries at non competitive rates, an additional 2.637 trillion was “borrowed” from Federal Agencies and Trusts to buy additional treasuries at non competitive rates, this 8.35 trillion pushed Treasury yields to near zero and enabled the U.S. Treasury to pay 12.554 trillion less in interest on the federal debt than if the Treasury rate was tied to reported inflation.
18) In contrast for the 37 years prior to the Federal debt downgrades and creation of money to buy debt at non competitive rates the U.S., on a fraction of the debt paid an average of 3.99% above reported inflation or 6.202 trillion more than if the Treasury rate was tied to the reported inflation..

19) The creation of money with no effort to control deficit spending is what caused the Federal debt downgrades,
Currently the Federal Reserve is holding over 8 trillion in paper they bought with created money during the last two crises, when the Federal Reserve resumes QE this time round both S&P and Fitch said they would downgrade U.S. Federal debt from the current AA+ Negative to as low as AA- stable, at AA- stable U.S. Federal debt would be rated the same as Estonia and Slovenia. An AA- stable rating will also narrow the Federal Government’s buying pool even further by eliminating institutions, Insurance companies, Trusts and Pensions that will no longer be able to buy U.S. debt because it is rated too low, leaving yet another gap for the Federal Reserve to fill by creating even more money.
20) Use this link to monitor total money created by the Federal Reserve, in 2023 as in 2019 (before the covid crisis) we’re seeing a reduction in the Fed’s balance sheet which will be temporary followed buy a spike higher that I believe will take total money created by the Fed from the current 8+ trillion to more than 14 trillion by 2026.

21) Ironic how during the period of dangerously low inflation form 2008-2021 which according to the Fed required them to create trillions dollars gold rallied from $643 to $2000 per ounce up 211.07%?

22) During this period of dangerously low inflation consumer loans from stayed steady averaging 13.149% from 2008-2022, according to the Federal Reserve and Federal Government, stripping savers of interest income, devaluing their currency and letting banks that their tax dollars bailed out overcharge them on their consumer loans is good thing for them and the U.S. economy?.

23) If rates stay at 5.50% Federal debt service cost, will cause U.S insolvency, bank failures from existing leveraged Treasury positions, declining real estate prices, mortgage defaults and ultimately another mortgage crisis..
Another mortgage crisis?
24) Commercial Mortgages have increased from 2.77 trillion in 2008 (start of the last banking crisis) to 3.58 trillion in 2023 +29.24%, 897 billion of this 3.58 trillion or 23.35% is coming due within the next 12 months. In th last 12 months commercial real estate had it’s biggest decline since 2008
Commercial mortgage rates for the refi on these properties has increased from 3.51% to 6.74%.
25) In 2019 the vacancy rate, was 7.01%, in 2023 18.60%, this number will increase as leases expire, and are not renewed. Local governments forcing employees to work from home during the covid scamdemic ensures many of these employees will never return full time to the office, retail covid closures, online sales of products at more competitive prices have lessened demand for retail space, many of the retailers that survived covid and online competition were finished off by looters, this decline in demand is expected to push the average vacancy rate from 18.60% to above 27% prior to 2026,
26) With fewer tenants, nearly twice the carry cost and 29.24% of the commercial mortgages needing to be refinanced over the next 12 months, commercial property is holding together far better than expected with first quarter delinquency rates still below 1.00% (2010 recent high 8.93%) unfortunately it’s expected to rise above 4.00% prior to 2026 putting pressure on banks and other institutions that hold mortgages and mortgage backed securities. .
27) Monitor total commercial mortgages, rate of change and Delinquency rate

28) Total Residential Mortgages have increased from 11.322 trillion in 2008 to 13.430 trillion in 2023 up 18.61%, of the 13.430 trillion, 1.317 trillion, 10.21% are adjustable.
Monitor total mortages rate of change

29) Residential 30 year fixed mortgage rates have increased from 2.67% to 6.81%

30) Home affordability for the median American family in 2023 it’s non existent
Real household income is down 2.77% from 2020, median post tax monthly family income stands at $5,226, median monthly home ownership cost, $2,962.94, median cost of 1 automobile $894, median cost for family health insurance $1,280, this leaves $89 per month for all other family expenditures, this math makes it clear it’s impossible for a median U.S. family to currently buy a median family home.
According to Forbes post tax family income to comfortably afford a median priced home in the U.S. should be $10,750 per month, roughly twice current median family post tax income this by itself will pressure home prices lower, additional pressure will be generated from holders of adjustable rate mortgages who will not be able to afford afford higher rate and will foreclose
31) Initial impact of the rate hikes on home prices .
Median Home prices have dropped from $479,500 to $416,100, -13.22% in 2023 and are expected to fall further, if the decline exceeds 20% to $383,600 many of the analysts I follow tell me they won’t stabilize until they drop to 2020 levels of $322,500, This will hammer banks that are holding mortgage debt and investors holding mortgage backed securities.

32) Monitor total transactions, an increase gives a good idea of how hot a market is, decrease how cold..

33) Summary
It’s safe to say with these fundamentals a “soft landing” for the U.S. economy is highly unlikely.
Continued out of control deficit spending with zero plans to rein it in, the only thing they’ve tried to get through to reduce the deficit is hiring 87,000 additional IRS agents to squeeze more money out of their citizens or destroy their political opponents, I can’t understand why the majority of the U.S. is OK with this?
The biggest issue for the U.S. in 2023 is there are not enough buyers for their debt on the open market with the Federal Reserve, Federal Agencies and Trusts tapped out and, non U.S. investors going from buyers to sellers of U.S. Treasuries.
Banks that are holding far more leveraged debt than 2008 with trillions in unrealized loses.
Real estate prices having their biggest decline since 2008, mortgage rates more than doubling , commercial vacancy is at 18.06% and climbing, home affordability non existent, leaves only one direction that real-estate can go if rates stay constant or rise
The only thing that could prevent further bank insolvencies, declining real estate prices and another mortgage crisis is a cut in the Fed Funds rate by at least 2.50% and the creation of more money, this might buy the U.S. some time but will ultimately lead to further debt downgrades, the dollar losing it’s status as the world’s reserve currency and eventual collapse of the U.S. dollar and debt market.
34) Fact, in 2023 the situation in the U.S. is beyond repair, I would challenge anyone to present a viable solution that could prevent what I believe will be a monetization meltdown in the U.S. by 2026..
In 2023 we have two choices, prepare for the coming major market moves to protect and enhance family wealth or be complacent ignoring the severity of these dismal, verifiable fundamentals and watch our wealth evaporate.
35) I’m preparing for tomorrow’s major market moves today and making sure I have multiple tools and programs in our line-up to capture these moves long or short, to monitor trades as the occur the ORDERS.TXT file on this page.
If you have any questions, please contact me.
 Peter Knight
Voice & Video Chats.
Message me