Index Analysis Page

Chart

Trend Qualification Procedure

1.1) Chart to initially qualify the trend using an EMA9, if price action is above the red line (EMA9) you’re in an up-trend, below the red line (EMA9) a down-trend.

1.2) Confirm the EMA9 defined trend using these indicators. If the chart in 1.1 and the trend confirmation in 1.2 do not agree stand aside.

1.3) Support & Resistance for setting profit objectives and risk levels, contact me for more information on how we use these.

1.4) Trading methodology video (using the S&P as the example)
1.5) Premium neutral collars to objectively define risk on every trade


1.9) 15 Year Monthly Data
1.8) 3 Year Chart, Weekly Data
1.7) 6 Month Chart, Daily Data
1.6) 5 Day (15 minute data)
1.10) Futures Quotes
1.11) Options Quotes
1.12) Contract Specifications
1.13) Margin Requirement

Educational Resources

Futures Options Gold & Metals Stock Indices Currencies Interest Rates

2) General Information on Futures and Futures Options

2.1) Futures Educational Videos (60)
2.2) Futures Options Educational Videos (34)

3) Stock Index Educational Videos

3.1) What is a Futures contract?
3.2) What is an Equity Index Futures
3.3) About S&P Futures and Contract Specifications
3.4) Definition of Margin
3.5)
The Benefits of Futures Margins
3.6) Fundamentals and Equity Index Futures
3.7)
Who Uses Equity Index Products?

3.8) Why Trade Futures instead of ETFs?
3.9)
Hedging and Risk Management for Equity Index Futures

3.10 Trading Opportunities in Equity Index Futures
3.11) Other Opportunities in Equity Index Futures

3.12) How to Trade Select Sectors
3.13)
Explaining Call Options (Short and Long)
3.14) Explaining Put Options (Short and Long)
3.15) Trading Options During Economic Events
3.16 Option Collars what they are and the basics of how they work
3.17) Working Example of Collaring a Position
3.18) Equity Index Daily & Final Settlement
3.19) Rolling an Equity Position Using Spreads
3.20) What is Equity Index Basis?
3.21) Equity Index Notional Value and Price
3.22) The Importance of Depth (Volume)
3.23) Equity Intermarket Spreads
3.24) Implied Liquidity in Select Sector Futures
3.25
) Influence of Pricing on the Option for Equity Traders
3.26) Why Options on Futures Gives Added Benefit of Diversifying Risk
3.27) Alpha/Beta and Portable Alpha
3.28) Cash Equitization – Cash Drag in the Cross Hairs
3.29) Transition Management using Stock Index Futures
3.31) Beta Replication and Smart Beta
3.31) Additional Educational Information on Stock Indices

4) Program Structure and Account Opening Procedure

4.1) ATA’s, What They Are and How They Work
4.2) The Fee Structure For This Program
4.3) Defining Overall Risk For Your Account

4.4) Exchanges Traded
4.5) Brokerage Firms
4.6) How Balances Are Guaranteed Plus or Minus Trading
4.7)
How To Open An Account

If you have questions send a message or contact me.

Regards,
Peter Knight Advisor

—————————————————————-

Privacy Notice

Disclosure

NASDAQ

Today’s technical opinion
3 month chart, daily
Futures Quotes

Options Quotes
Historical Data

1) Simplified Trend Qualification Procedure

1.01) If price action is above the red line and red is above blue = long.
1.02) Risk on long positions, if red moves below blue exit the trade.
1.03) If price action is below the red line and red is below blue = short.
1.04) Risk on short positions, if red moves above blue exit the trade.
1.05) Same rules apply for all time periods using 1 hour to weekly bars.
Prices are updated every 10 minutes, if you have questions contact me.

Chart We’re using daily price bars on the chart below for short-term trades, this same procedure will work using any time frame from 15 minutes bars to monthly bars, it depends on whether your objective is trading intra-day, short, medium, or long-term, ATAs can be set up to trade all time periods or any combination of time periods

2) Quotes, Charts & Analysis

2.01) Today’s technical opinion
2.02)
2 day chart, 15 minute data

2.03) 3 day chart, 30 minute
2.04) 5 day chart, 60 minute data
2.05) 10 day chart, 120 minute
2.06) 3 month chart, daily
2.07) 9 month chart, daily
2.08) 1 year chart, weekly
2.09) 3 year chart, weekly
2.10) 7 year chart, monthly
2.11) 15 year chart, monthly
2.12) 1983 – current chart
2.13) Ranges & price performance

2.14) Support & resistance
2.15) Futures Quotes

2.16) Options Quotes
2.17) Exchange = CME
2.18)
Contract Specifications

2.19) Margin Requirement

3) Educational Resources

General Information on Futures and Futures Options

3.01) Futures Educational Videos (60)
3.02) Futures Options Educational Videos (34)

Stock Index Educational Videos

3.03) What is a Futures contract?
3.04) What is an Equity Index Futures
3.05) About S&P Futures and Contract Specifications
3.06) Definition of Margin
3.07)
The Benefits of Futures Margins

3.08) Fundamentals and Equity Index Futures
3.09)
Who Uses Equity Index Products?

3.10) Why Trade Futures instead of ETFs?
3.11)
Hedging and Risk Management for Equity Index Futures

3.12 Trading Opportunities in Equity Index Futures
3.13) Other Opportunities in Equity Index Futures

3.14) How to Trade Select Sectors
3.15)
Explaining Call Options (Short and Long)
3.16) Explaining Put Options (Short and Long)
3.17) Trading Options During Economic Events
3.18) Option Collars what they are and the basics of how they work
3.19) Working Example of Collaring a Position
3.20) Equity Index Daily & Final Settlement

3.21) Rolling an Equity Position Using Spreads
3.22) What is Equity Index Basis?
3.23) Equity Index Notional Value and Price
3.24) The Importance of Depth (Volume)
3.25) Equity Intermarket Spreads
3.26) Implied Liquidity in Select Sector Futures
3.27
) Influence of Pricing on the Option for Equity Traders

3.28) Why Options on Futures Gives Added Benefit of Diversifying Risk
3.29) Alpha/Beta and Portable Alpha
3.30) Cash Equitization – Cash Drag in the Cross Hairs
3.31) Transition Management using Stock Index Futures
3.32) Beta Replication and Smart Beta
3.33) Additional Educational Information on Stock Indices

4) Program Structure and Account Opening Procedure

4.01) ATA’s, What They Are and How They Work
4.02) The Fee Structure For This Program
4.03) Defining Overall Risk For Your Account

4.04) Exchanges Traded
4.05) Brokerage Firms
4.06) How Balances Are Guaranteed Plus or Minus Trading
4.07)
How To Open An Account

If you have questions send a message or contact me.

Regards,
Peter Knight Advisor

—————————————————————-

Privacy Notice

Disclosure

S&P 500 Analysis Page

Today’s technical opinion
3 month chart, daily
Futures Quotes
Option Quotes
Historical Data

1) Simplified Trend Qualification Procedure

1.01) If price action is above the red line and red is above blue = long.
1.02) Risk on long positions, if red moves below blue exit the trade.
1.03) If price action is below the red line and red is below blue = short.
1.04) Risk on short positions, if red moves above blue exit the trade.
1.05) Same rules apply for all time periods using 1 hour to weekly bars.
Prices are updated every 10 minutes, if you have questions contact me.

Chart We’re using daily price bars on the chart below for short-term trades, this same procedure will work using any time frame from 15 minutes bars to monthly bars, it depends on whether your objective is trading intra-day, short, medium, or long-term, ATAs can be set up to trade all time periods or any combination of time periods

2) Quotes, Charts & Analysis

2.01) Today’s technical opinion
2.02)
2 day chart, 15 minute data

2.03) 3 day chart, 30 minute
2.04) 5 day chart, 60 minute data
2.05) 10 day chart, 120 minute
2.06) 3 month chart, daily
2.07) 9 month chart, daily
2.08) 1 year chart, weekly
2.09) 3 year chart, weekly
2.10) 7 year chart, monthly
2.11) 15 year chart, monthly
2.12) 1983 – current chart
2.13) Ranges & price performance
2.14) Support & resistance
2.15) Barchart quotes, all deliveries
2.16) Barchart options quotes
2.17) CME Futures quotes, all deliveries
2.18) CME option quotes

2.19) Exchange = CME
2.20)
Contract specifications each 1.00 = $50.00

2.21) Exchange margin requirement
2.22) S&P 500 collar spreadsheet

3) Educational Resources

General Information on Futures and Futures Options

3.01) Futures Educational Videos (60)
3.02) Futures Options Educational Videos (34)

Stock Index Educational Videos

3.03) What is a Futures contract?
3.04) What is an Equity Index Futures
3.05) About S&P Futures and Contract Specifications
3.06) Definition of Margin
3.07)
The Benefits of Futures Margins

3.08) Fundamentals and Equity Index Futures
3.09)
Who Uses Equity Index Products?

3.10) Why Trade Futures instead of ETFs?
3.11)
Hedging and Risk Management for Equity Index Futures

3.12 Trading Opportunities in Equity Index Futures
3
.13) How to Trade Select Sectors
3.14)
Explaining Call Options (Short and Long)
3.15) Explaining Put Options (Short and Long)
3.16) Trading Options During Economic Events
3.17 Option Collars what they are and the basics of how they work
3.18) Working Example of Collaring a Position
3.19) Equity Index Daily & Final Settlement

3.20) Rolling an Equity Position Using Spreads
3.21) What is Equity Index Basis?
3.22) Equity Index Notional Value and Price
3.23) The Importance of Depth (Volume)
3.24) Equity Intermarket Spreads
3.25) Implied Liquidity in Select Sector Futures
3.26
) Influence of Pricing on the Option for Equity Traders

3.27) Why Options on Futures Gives Added Benefit of Diversifying Risk
3.28) Alpha/Beta and Portable Alpha
3.29) Cash Equitization – Cash Drag in the Cross Hairs
3.30) Transition Management using Stock Index Futures
3.31) Beta Replication and Smart Beta
3.32) Additional Educational Information on Stock Indices

If you have questions contact me.

Regards,
Peter Knight Advisor

—————————————————————-

Privacy Notice

Disclosure

S&P Drawdown 20181116

We’ve seen an overall trend reversal in Global Stock Indices from up to down, currently 11 are technically in a bear market.

Analysis & Quotes Chart Defined Trend Overall Composite
S&P 500 Down Sell
Nasdaq Down Sell
Euro Stoxx 50 Down Sell
Euro Stoxx E600 Down Sell
DAX Index Down Sell
CAC 40 Down Sell
Swiss Market Index Down Sell
Hang Seng Index Down Sell
Nikkei Down Sell
ASX 200 Index Down Sell
FTSE 100 Down Sell
News last hour Last 24 hours Last week

For long term trend following programs major trend changes are always costly.

For the S&P collar ATA  February 2018 was the first larger than normal  draw-down for 2018 generating an Intra-month loss of ($7,910) on 12th of February 2018.

We did see a  recovery of +3,375 before to the end of February 2018 but still closed the month out with a net loss ($4,175). Although this draw-down was deep it was quick and we had a full recovery with net new equity high by the end of March 2018.

Chart

S&P Performance February – March 2018 (Collar Program)

As of 16 November 2018 we are now experiencing yet another large draw-down of ($8,989) surpassing February’s by over $1,000 putting us ($3,468) from the all time previous worst case of ($12,457).

Chart

S&P Performance August – November 2018 (Collar Program)

Although this draw-down is deep it is consistent with other draw-downs we’ve experienced  during other major trend changes for the life of this program.

Previous draw-downs

November 2007 Intra-month ($12,457), net P&L for November 2007 of ($10,812) this draw-down occurred prior to a major trend reversal from up to down

Chart

Full recovery to a net new high January 2008

October 2008 Intra-month draw-down ($11,187) with a net P&L for November 2008 of ($10,050) again this draw-down occurred prior to the major trend change from down to up.

Chart

Full recovery to a net new high November 2008

Although we’ve had two bad draw-downs this year I have confidence in the S&P Collar ATA and believe it will recover to a net new high within the next 4 to 12 weeks.

I do have two main concerns

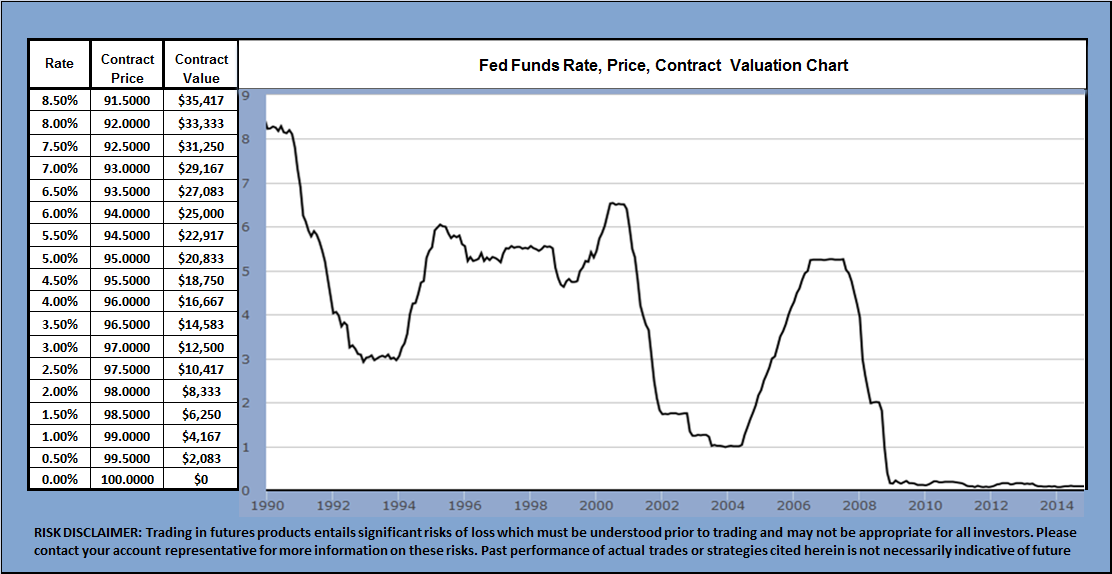
1) Contract valuation relative to draw-downs and profit cycles

2) Is this trend change for real? Will the Economic fundamentals back it up? Or is this just another false reversal like the one we saw in February 2018?

Contact valuation relative to draw-downs and profit cycles

During the 2007 draw-down ($12,457) the value of an S&P contact was $77,450, during the 2008 draw-down ($11,187) contract value $48,400.

In 2018 the contract value is $136,600. My concern is with a larger contact value we could potentially see larger draw-downs (and profit cycles).  Example 2018 contract value is 76.37% larger than 2007, in theory because this program uses a percentage of the contact value for risk control and profit objectives the previous worst case draw-down could potentially increase by 76.37% from ($12,457) to ($21,970).   At the same time the average profit per year could also increase from $27,473 to $48,930. Larger draw-downs do not mean a program is failing as long as they are accompanied by larger profit cycles and the average profit per year relative to the maximum draw-down ratio remains intact.

I have experienced larger draw-downs & profit cycles due to increased contract valuation before trading a WTI Crude Oil program.

WTI Crude Oil went from $15,000 per contract in 1994, to $78,000 in 2007, then $147,270 in 2008, then back down to $113,930 in 2011. During 1994-2011 both the draw-downs and profit cycles increased proportionately to contract valuation.

Average profit per year relative to maximum draw-down remained at a ratio of 2.3 to 1.

Crude oil 20 year chart

I believe the same scenario could occur in the S&P and we should be prepared for the current draw-down to increase from ($12,457) to potentially ($18,000). It may not occur but with a contact value of $136,600 versus $77,450 a higher draw-down is a definite possibility.

If this potential increase in draw-down is unacceptable for your risk tolerance I suggest downshifting to a program that trades markets with more consistent contact valuations like currencies, for example the EUR-CHF or the Short Term FX Directional 

I believe currencies will trend and overall contract valuations will continue to be more consistent than in any other sector. All major Central Banks have acknowledged they will continue to devalue their currencies relative to tangible assets like gold, energy, real estate, shares and agricultural markets. None have an inflation target of 0.00%.

FX Analysis & Quotes Chart Defined Trend Overall Composite
Euro-FX Down Sell
British Pound Down Sell
Japanese Yen Down Hold
Australian Dollar Up Sell
Candian Dollar Down Sell
Swiss Franc Down Sell
USD Index Up Buy
Chinese Renminbi Down Sell

Why 2018 seems like such a difficult year.

From 2009 through 2017 the S&P was one of the easiest markets I’ve traded  in my 25+ year career, trends don’t get much better than below.

Chart

Technically the longest bull market in history has ended, we’ve seen sideways volatility coupled with higher contract valuations which has generated higher than normal loses during this major trend change.

Chart

The good news is the long-term trend has clearly reversed from up to down

Chart

The overall average, short-term, medium-term and long-term indicators  are all confirming the trend reversal.

Current Indicators

If this trend reversal is real we should see carry through and an accelerated move to the downside generating a substantial profit cycle similar to what we experienced in 2013, 2014 and 2015.

My second concern:

Are economic fundamentals and related market price action in agreement with the current major trend reversal in the S&P from up to down?

According to Fed Chair Powell the economy is robust, on track and to expect 5 more 0.25% rate hikes by December 2020.

1) Highlights from the last Fed press conference (5:00)

16+ trillion in the face value of open interest rate derivatives positions tells us a completely different story, this 16 trillion has gone from pricing in 0.84% of the Fed’s expected 1.25% rate  hikes in 2013 to just 0.34% currently.

Chart

During the period from December 2019 to December 2020 the market has gone from pricing in 0.34% of the Fed’s expected 0.25% to 0.50% in rates hike to a decrease in rates of 0.02%. Translated the interest rate market is telling us to  expect a sharp sell off in stocks and a potential recession in 2019.

Chart

Federal Reserve Vice Chairman Richard Clarida made statements consistent with what the market is pricing in contrary  to Fed chair Powell’s statements See this CNBC report

Vice chair Clarida’s statements on Friday the 16th of November motivated a hard sell off in the US dollar

Chart

And a further decrease in rate hike expectations Friday from 0.38% down to 0.34%. This month alone the market’s expectations for rate hikes between November 2018 and December 2020 have dropped from 0.53% on the 8th of November to 0.34% on the 16th of November versus the Fed’s expectations of an increase of 1.25% by December 2020. Again the interest rate market is pricing in a sharp decline in stocks and potential recession in 2019.

Chart

The curve is also narrowing

1997-2018 Chart

A narrowing curve is consistent with every major sell off in stocks over the last 20 years.

1997-2018 S&P Chart

Gold’s trend is reversing from down to up indicating flight to safety.Gold also has been a costly market for the long-term Gold ATA as this trend materializes.

Chart

Crude is selling off

Chart

I also believe all the good news has been priced into the US stock market and anything but better than expected economic reports will cause a sell off in US shares.

Bear and bull markets are a fact of life and I believe the one currently on deck could dwarf  anything we’ve seen to date, I’m just hoping it fully engages before I have to trade though periods like the current draw-down or the one we saw in February.

Major/Minor Bull, Bear markets 1983 to 2018

1983-2018 chart
January 1983 – August 1987 Bull 139.72 – 337.89 =+141.83%
August 1987 – October 1987 Bear 337.89 – 216.47 =-35.93%
August 1987 – August 1989 Bear to recovery (2 years)
August 1987 – July 1990 Bull 216.47 – 369.78 = +70.82%
July 1990 October 1990 Correction 369.78 – 294.51 =-20.36%
July 1990 – February 1991 Correction to recovery (7 months)
October 1990 – July 1998 Bull 294.51 – 1,190.58 =+304.26%
July 1998 – October 1998 Correction 1,190.58 – 923.52 =-22.43%
July 1998 – November 1998 Correction to recovery (4 months)
October 1998 – March 2000 Bull 923.52 – 1,552.87 =+68.15%
March 2000 October 2002 Bear 1,52.87 – 768.63 =-50.50%
March 2000 December 2007 Bear to recovery (7 years 9 months)
October 2002 – October 2007 Bull 768.63 – 1,576.09 =+105.05%
October 2007 – March 2009 Bear 1,576.09 – 666.79 =-57.68%
October 2007- April 2013 Bear to recovery (5 years 6 months)
March 2009 – October 2018 Bull 666.79 – 2,872.87 = +330.87%

If you can tolerate the risk I’d stay with the program if not I would down shift  to the EUR-CHF or the Short Term FX Directional

If you have questions send a message or contact me.

Regards,
Peter Knight Advisor

—————————————————————-

Privacy Notice

Disclosure


Fundamentals

1)   The US economy & inflation using the Fed’s numbers
2)   Reported Versus Actual Inflation
3)   Inflation Engaging
4)   Rates are rising the yield curve narrowing
5)   Rate Futures are now pricing in a 2019 recession
6)   Stock are overvalued relative to gold
7)   The only solution left for US Treasury debt crisis
8)   News on the US/China Trade War
9)   Chronology of the US China Trade War
10) Latest Trump Troubles
11) A Divided America

Fed Charts

12) US deposit rates versus the CPI
13) US bank borrowing cost to lending rate
14) US annual budget deficits
15) US Federal Debt
16)
US debt to tax receipt growth

17) US median priced home
18) US debt to GDP ratio
19) US trade deficits
20) Emergency purchases of US debt by the Federal Reserve
21) US debt to personal income ratio
22) US debt to employed population
23) US debt to hourly earnings
24) US mortgage delinquency
25) US debt to GDP ratio relative to China
26) US growth ratio relative to China
27) US trade deficits relative to China
28) USD against China’s currency (Renminbi)
29) US Versus China’s short term interest rates
30) Offshore Chinese Renminbi Market (CNH)
31) Chinese Renminbi/USD Futures
32) Chinese Renminbi/USD Quotes
33) US credit rating versus other countries
34) US Treasury debt held by non US investors
35) Treasury auction basics
36) US debt service cost to tax receipts
37) CPI using pre 1980 & 1990 calculations

38) CPI ABC chart
39) Current CPI ABC chart
40) Why inflation does not match the true CPI
41) US Debt, Tax receipts and CPI
42) Tax receipts. median home, M1, gold, CPI
43) The last tightening cycle
44) Fed funds contract valuation chart
45) Current Fed funds chart and all historical data
46) US Debt service cost
47) Federal debt to debt service cost
48) Bloomberg Fed funds quotes
49) CPI using current calculation methods
50) CPI using the Fed 1990 calculation methods
51) BLS.GOV “official CPI
52) Federal debt, M1 and CPI

If you have any questions send a message or contact me

Regards,
Peter Knight Advisor

—————————————————————-

Privacy Notice

Disclosure


Economic Data

Economic Calendar Market Commentary
Federal Government; Interest Paid Bureau of Economic Analysis
Total Federal Debt (Source Fed) Total U.S, Population
Debt Clock & Analysis Employed Population
Federal Debt 1900-present Manufacturing Jobs
End of the 10% reserve requirement U.S. Household Income
M-2 New Unemployment Claims
Total Federal Revenue New Hires
Reported Federal Spending Reported Unemployment
Reported Budget Deficits Gold Price History
U.S. GDP Reported Inflation
Federal Debt to GDP BLS Reported Inflation
Money Created by the Federal Reserve Shadow Stats
Annual Remittances Fed to the Treasury BLS.GOV inflation Calculator
Federal Debt Held by Agencies & Trusts Current Debt Service Cost
Federal Debt Owned by the Fed Reserve U.S. Debt Rating
Fed Overnight Repo   
U.S. Trade Deficits Historical Debt Service Cost
Foreign Owned Federal Debt Historical Data Fed Funds Rate
Mortgage Debt Owned by the Fed Reserve Historical Data 3 Month Rates
Mortgage Delinquency Rate Price of Gold 1833 to 2016
Median Home Sales Price (HUD revised) Pre Revision Median Home Price
Total Mortgages
Median Family Income
Mortgage rates Mortgage Calculator
Curve & Data Fed Meeting Schedule
Treasury calculator Probability of a rate hike
Bloomberg Treasury Yields All Fed Statements
Covid Deaths
Video Archive
Research Index Analysis
Bloomberg Radio Index News Past Hour
Barchart Index News Past 24 Hours
Street Insider Forex Analysis
Financial Times FX News Past hour
Reuters  FX News Past 24 Hours
Market Watch Energy Analysis
CNBC World Markets Energy News Past Hour
Yahoo Finance Energy News Past 24 Hours
Nasdaq Metals Analysis
Globe & Mail Metals News Past Hour
Australian Financial Review Metals News Past 24 Hours
Morningstar Interest Rate Analysis 
South China Morning Post Rate News Past 24 Hours

If you have any questions contact me

Regards,
Peter Knight Advisor

—————————————————————

Privacy Notice

Disclosure

100 Best/Worst Performing ETFs & Stocks

ETFs Stocks 
100 Best 100 Worst 100 Best 100 Worst
Today Today Today Today
5 Day 5 Day 5 Day 5 Day
3 Month 3 Month 3  Month  3 Month
12 Month 12 Month 12 Month 12 Month
3 Year 3 Year 3 Year 3 Year
5 Year 5 Year 5 Year 5 Year
10 Year 10 Year 10 Year 10 Year

If you have any questions send a message or contact me

Regards,
Peter Knight Advisor

—————————————————————-

Privacy Notice

Disclosure

Review Links

1) Economic Reports & Headline News
2) Fundamentals
3) The Importance of trading Long and short 1983-2018

4) We Provide Access to

4.1) 43 Exchanges
4.2) 70+ Brokerage Firms
4.3) Multi Manager Asset Allocation

5) We Trade
XX

ATAs all use fully disclosed trading methodology enabling you to verify past performance and/or monitor trades forward.x

6) Global Stock Indices

6.1) US Stock Index Futures Year to Date Price Change
6.2) US Stock Index Futures Long, Short, Hold Summary
6.3) Non US Stock Index Futures Year to Date Price Change
6.4) Non US Stock Index Futures Long, Short, Hold Summary

Analysis Pages EMA 9 Chart Long, Short,Neutral
S&P 500 Chart Opinion
Nasdaq Chart Opinion
Euro Stoxx 50 Chart Opinion
Euro Stoxx E600 Chart Opinion
DAX Index Chart Opinion
CAC 40 Chart Opinion
Swiss Market Index Chart Opinion
Hang Seng Index Chart Opinion
Nikkei Chart Opinion
ASX 200 Index Chart Opinion
FTSE 100 Chart Opinion
Index News Past Hour Index News Past 24 Hours Index News Past Week

7) Currencies

7.1) Currency Futures Year to Date Performance
7.2) Currency Futures Long, Short, Hold Summary

Analysis Pages EMA 9 Chart Long, Short, Neutral
Euro-FX Chart Opinion
British Pound Chart Opinion
Japanese Yen Chart Opinion
Australian Dollar Chart Opinion
Candian Dollar Chart Opinion
Swiss Franc Chart Opinion
USD Index Chart Opinion
Chinese Renminbi Chart Opinion
All Currency Quotes EUR-CHF GBP-EUR
FX News Past hour FX News Past 24 Hours FX News Past Week

8) Energy

8.1) Energy Futures Year to Date Price Change
8.2)
Energy Futures Long, Short, Hold Summary

Analysis Pages EMA 9 Chart Long, Short, Neutral
Crude WTI Chart Opinion
Crude Brent Chart Opinion
Heating Oil Chart Opinion
Gasoline Chart Opinion
Natural Gas Chart Opinion
Energy Quotes Brent Versus WTI Gold Oil Ratio
Energy News Past Hour News Past 24 Hours News Past Week

9) Metals

9.1) Metal Futures Year to Date Price Change
9.2) Metal Futures Long, Short, Hold Summary

Analysis Pages EMA 9 Chart Long, Short, Neutral
Gold Chart Opinion
Silver Chart Opinion
Platinum Chart Opinion
Copper Chart Opinion
Palladium Chart Opinion
All Metals Quotes Gold Versus Platinum S&P Gold Ratio
Metals News Past Hour News Past 24 Hours News Past Week

10) Interest Rates

10.1) US Rate Futures Year to Date Price Change
10.2)
US Rate Futures Long, Short, Hold Summary
10.3)
International Rate Futures Year to Date Price Change
10.4)
International Rate Futures Long, Short, Hold Summary

Analysis Pages EMA 9 Chart Long, Short, Neutral
3 Month Chart Opinion
30 Day Fed Funds Chart Opinion
2 Year Chart Opinion
5 Year Chart Opinion
10 Year Chart Opinion
30 Year Chart Opinion
3 EuriBor Chart Opinion
3 Month Sterling Chart Opinion
Euro Schatz Chart Opinion
Euro Bobl Chart Opinion
Euro Bund Chart Opinion
Euro OAT Chart Opinion
Euro Buxl Chart Opinion
US Rate Quotes Euro Rate Quotes Priced In Rate Hikes
Treasury Yields Treasury Calculator All Fed Statements
Rate News, Past Hour Rate News Past 24 Hours Rate News Past Week

11) ATA Structure and Account Opening Procedure

11.1) ATA’s, What They Are and How They Work
11.2) The Fee Structure For This Program
11.3) Defining Overall Risk For Your Account

11.4) Exchanges Traded
11.5) Brokerage Firms
11.6)
How Balances Are Guaranteed Plus or Minus Trading
11.7) How To Open An Account

If you have any questions send a message or contact me

Regards,
Peter Knight Advisor

—————————————————————-

Privacy Notice

Disclosure


EUR CHF Analysis Page

Forex Analysis Homepage

1) Simplified Trend Qualification Procedure,

1.01) Pick a time frame to work with from 15 minutes to monthly.
1.02) If price action is above the red line and red is above blue = long.
1.03) For longs, the overall average on 2.01 must be greater than a 29% buy.
1.04) Risk on longs, if the red line moves below the blue exit the trade.
1.05) If price action is below the red line and the red is below the blue = short.
1.06) For shorts, the overall average on 2.01 must greater than a 29% sell.
1.07) Risk on shorts, if the red line moves above the blue exit the trade.
1.08) Same rules apply for all time periods
Prices are updated every 10 minutes if you have questions send me a message.

2) EURCHF Analysis (cross cash market)

2.01) Today’s technical opinion
2.02) 1 day, using 5 minute bars
2.03) 2 day, 10 minute bars
2.04) 2 day, 15 minute
2.05) 4 day, 30 minute
2.06) 5 day, 60 minute
2.07) 5 day, 90 minute
2.08) 5 day, 120 minute
2.09) 10 day, 120 minute
2.10) 2 month, daily
2.11) 4 month, daily
2.12) 6 month, daily
2.13) 1 year, weekly
2.14) 2 year, weekly

2.15) 3 year, weekly
2.16) 4 year, weekly
2.17) 5 year, monthly

2.18) 10 year, monthly
2.19) 15 year, monthly
2.20) 20 year, monthly
2.21) Support and resistance
2.22) 1 month performance leaders
2.23) 3 month performance leaders
2.24) 6 month performance leaders

2.25) 12 month performance leaders

3) ATA summary & account opening procedure

3.01) ATA’s, What They Are and How They Work
3.02) ATA Program Performance Page
3.03) The ATA Fee Structure
3.04) Defining Overall Risk For Your ATA Account
3.05) How Balances Are Guaranteed Plus or Minus Trading
3.06) How To Open An Account Minimums 12.5K to 500K

If you have any questions send a message or contact me.

Regards,
Peter Knight Advisor

—————————————————————-

Privacy Notice

Risk Disclosure

EUR-CHF Trend Trader

Performance Summary 6  July 2009 –  31 October 2018

Recommended Starting Balance $12,500.00
Cumulative Net Profit
$105,507.65
Maximum Drawdown (45.90%)
($5,737.90 )
Best Year 2012  +112.93%
$14,116.55
Worst Year 2011 +60.28%
$7,535.56
2007-2018 Average +90.44%
$11,304.39
2018 +72.26%
$9,532.27

Risk Disclosure

Performance is based on trading one 12.5K unit, never adding units and deducting all net profits annually.

1) EUR-CHF  Analysis

1.1)   20 year chart using monthly price data
1.2)   7 year chart using monthly price data
1.3)   3 year chart using weekly price data
1.4)   1 year chart using daily data
1.5)   1 month chart using 120 minute bars
1.6)   10 day chart using 60 minute bars
1.7)   3 day chart using 15 minute bars
1.8)   1 day chart using
1.9)   EUR technical opinion
1.10) CHF technical opinion
1.11) EUR-CHF Margin Requirement
1.12) TradeView versus Saxo, Saxo Quotes

2) Euro-FX  Symbol (E6)

2.1)  15 year chart using monthly data
2.2)  7 year chart, monthly Data
2.3)  3 year chart, weekly data
2.4)  1 year chart, weekly data
2.5)   9 month chart, daily data
2.6)   3 month chart, daily data
2.7)   5 day chart 60 minute data
2.8)   1 day chart, 10 minute data
2.9)   Today’s Technical Opinion
2.10) Ranges & Price Performance
2.11) Support & Resistance
2.12) Barchart Quotes, All Deliveries
2.13) Barchart Options Quotes
2.14) CME Futures Quotes, All Deliveries
2.15) CME Option Quotes
2.16) Contract Specifications each 0.01 = $12.50

3) Swiss Franc  Symbol (S6)

3.1)  15 Year chart using monthly data
3.2)   7 Year Chart, monthly Data
3.3)   3 Year chart, weekly data
3.4)   1 year chart, weekly data
3.5)   9 month chart, daily data
3.6)   3 month chart, daily data
3.7)   5 day chart 60 minute data
3.8)   1 day chart, 10 minute data
3.9)   Today’s Technical Opinion
3.10) Ranges & Price Performance
3.11) Support & Resistance
3.12) Barchart Quotes All Deliveries
3.13) Barchart Options Quotes
3.14) CME Futures Quotes All Deliveries
3.15) CME Option Quotes

3.16) Contract Specifications each 0.01 = $12.50

4) Program Structure and Account Opening Procedure

4.1) (ATA’s), What They Are and How They Work
4.2) The Fee Structure For This Program
4.3)
 Defining Overall Risk For Your Account

4.4) How Balances Are Guaranteed Plus or Minus Trading
4.5)
How To Open An Account

If you have questions send a message or contact me

Regards,
Peter Knight

—————————————————————-

Privacy Notice

Risk Disclosure