Automated Trading Accounts (ATA)

S&P homepage

As our ATA Client you maintain control of

  • The market(s) you trade and when
  • The methodologies you trade
  • The level of leverage that suits your risk tolerance
  • The overall risk for your account

The ATA Team’s responsibilities include

  • Calculating entries, risk levels and profit objectives
  • Placing all orders and diligently overseeing executions, positions and balance
  • Monitoring total account risk to ensure it is within your defined guidelines
  • Ensuring everything is done correctly and assuming liability if it’s not
  • Answering all your questions on markets and methodologies

About this ATA

  • This ATA uses fully disclosed trading methodology.
  • Trades with the trend long or short.
  • Uses option collars that define risk on every trade and duration of every trading period.
  • Trades in this ATA cannot be stopped out regardless of market volatility.
  • The only way a position can be called away is at a profit
  • If the market stays the same this ATA hasn’t wasted precious investment capital on purchasing option time premium as it’s collecting approximately as much  time premium on the covered writes at the profit objectives, as it’s paying out on the purchased options that define maximum trade risk.
  • Option collars can be offset at any time locking in gains and/or modified to capture more of the move or, reversed to capture a trend reversal.
  • Mark-to-market positions and balance are available online at any time.
  • Statements are emailed daily disclosing positions, liquidating value and any trading activity
  • Monthly statements summarize all activity and end of month balance.
  • Liquidity for ATA accounts in portion or all is 2 to 48 hours in any major currency.
  • AIM ATA’s afford you the opportunity to modify markets, units you trade and your overall account risk level at any time.

If you have questions or comments send me a message or  schedule an online review

—————————————————————-

Disclosure


Defining number of positions, risk levels and profit objectives

1) Trading procedure

1.1) Define trend using this procedure
1.2) Define trade risk using this procedure

2) Define number of contracts traded

This program trades up to 5 contracts with the trend up or down using “option collars”  that define risk on every trade and for the duration of every trading period.

  • Up to 2 short-term positions, trade duration 2 to 10 days
  • Up to 2 medium-term, trade duration 11-29 days
  • 1 long-term, trade duration 30 to 90 days
  • Total margin requirement is less than $15,000 USD or major currency equivalent as all positions are fully hedged.

2.1) Trade duration and number of contracts traded are determined by the opinion  For example a weak trend would justify having 1-2 short-term positions, intermediate strength +1-2 additional medium-term positions, strong  +1 for a long-term, total 5, all are collared, all have defined risk. 

2.2) And relative strength  increasing add positions, decreasing lighten up.

3) Profit objectives/risk levels are dependent on the trade duration,

Short term = 2 to 10 days
Medium term = 11 to 29 days
Long term = 30 to 90 days

And corresponding support -resistance levels and turning points

3) Trading parameters for short, medium and long-term positions.

3.1) Long-term trend, is the monthly price action above or below the EMA9  linked here? above = buy, below = sell.

Trade duration 30 to 90 days

In this example price action is above the EMA9 using monthly price action, the long term trend is higher but deteriorating, long term, long positions would be permitted if confirmed buy the overall average and long-term indicators linked below.

Does the overall average and long-term technical opinion linked here  agree with the EMA9?

In the example the EMA9 was a buy, indicators a sell.

If the EMA9, overall average and long-term indicators all agree long term trades of 30 to 90 days in duration are permitted using defined risk strategy.

In the example above no new trades would be permitted, an existing long term trade would have been liquidated. (total long-term positions permitted per unit 1)

EMA9 using monthly data = buy
Overall average = 48% sell
Long term indicators = hold

3.2) Medium-term trend, is weekly price action, above or below the EMA9  linked here? above = buy, below = sell.

Trade duration 11 to 29 days

In this example price action is below the EMA9 using weekly price action the market is in a down trend, medium-term, short positions are permitted.

Does the overall average, and medium-term technical opinion  linked here  agree with the EMA9?

In the example yes

If the EMA9, overall average and medium-term indicators all agree medium-term trades of 11 to 29 days in duration are permitted using defined risk strategy.

EMA9 using weekly data = sell
Overall average = 48% sell
Medium term indicators = 50% sell

In this example all agree, overall average and medium-term indicators are equal too or below 50%, only 1 medium-term short position is permitted, when both the overall average and medium-term indicators are greater than 50.00% a secondary medium-term position is permitted, (total permitted per unit 2).

3.3) Short-term trend, is daily price action, above or below the EMA9 linked here  above = buy, below = sell.

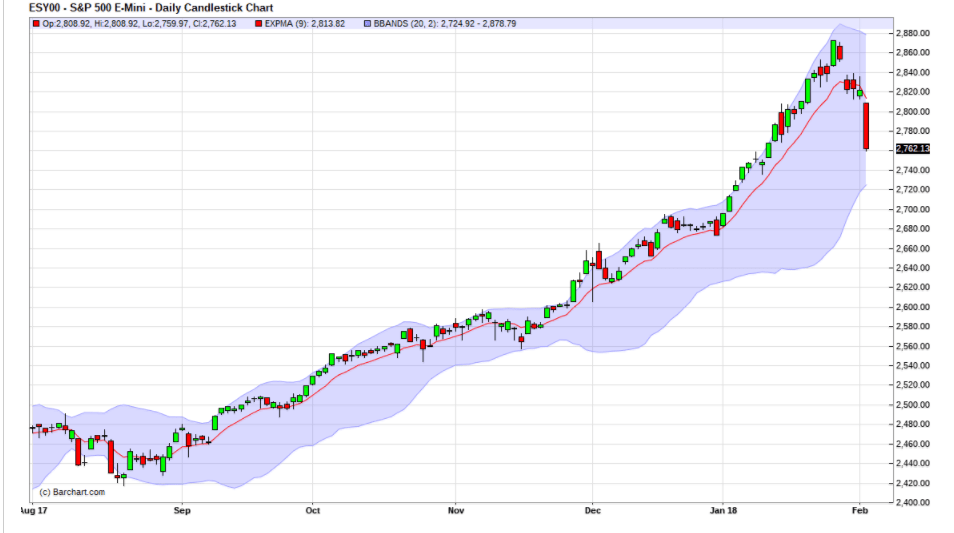
In this example price action is below the EMA9 using daily price action the market is in a short-term downtrend, sort-term, short positions permitted.

Trade duration 2 to 10 days

Does the overall average and short-term technical opinion  linked here  agree with the EMA9?

In this example yes

If the EMA9, overall average and short-term indicators all agree short-term trades of 2 to 10 days in duration are permitted using defined risk strategy.

EMA9 using daily data = sell
Overall average = 48% sell
Short-term indicators = 60% sell

In this example all agree, overall average is 48% sell, short-term indicators are 60% sell. You would already be short 1 contact in this example looking to add an additional short position when the overall average moves from 48.00% to above 50%. When both the overall average and sort-term indicators are greater than 50.00% a secondary short-term position is permitted, (total permitted per unit 2).

3) Summary

Define the trend using the EMA9

4.1) 6 month chart (daily data) used for short term trades (2 to 10 days)
4.2) 2 year chart (weekly data) medium term trades (11-29 days)
4.3) 7 year chart (monthly data) long term trades (30 to 90 days)

Set you profit objective and collar up your risk

4.4) Futures quotes
4.5) Options quotes
4.6) Support -resistance levels and turning points

If you have questions or comments send us a message or  schedule an online review

—————————————————————-

Disclosure

Defining risk on every trade and for the duration of every trading period 

Defining risk using “option collars”

1) Procedure for a Collared Long Position

1.1) On the 15th of September 2017 was telling us the S&P is in a medium-term up trend and to structure trades for 11 to 29 days.

Enter a long futures position at 2,500.00
Contract value $125,000.00

1.2) Determine the profit objective

In this example I’m simplifying the profit objective procedure by extending the angle of the slope using the medium-term EMA9 chart  by the maximum trade duration of 29 days to generate a profit objective of 2,550.00 contract value $127,500.00.

Profit Objective 2,550.00
Contract value $127,500.00

2) Collaring the trade

2.1) At the 2,550.00 profit objective I sell an out of the money,  call option against the my long position at the closest strike price to the objective of 2,550,00.

2.2) I’ll chose an options expiration that is consistent with the maximum trade duration for the trade, in this example 29 days, 13th of October 2017.

2.3) When you sell a call  against your 2,500.00 long futures position (covered call) you’re collecting option time premium, in this example we’ve collected 15.00 points or +$750.00.

How we objectively define risk

2.4) Using the collected premium from the covered call of 15.00 points, ($750.00)  I buy a put option.

2.4) The put option purchased must have the same option expiration as the call we wrote, in this example the option expiration for the call we wrote is the 13th of October 2017, the put purchased must have the same expiration date.

2.5) The put  strike price should be approximately the same distance from our 2,500.00 long entry as the call we wrote at the 2,550 objective (50 points).
2,500.00 entry – 50.00 = 2,4550.00, the put I purchase to define my risk should be at a strike of 2,450.00 or higher.

2.6) The option premium price paid for the put option to define risk should be approximately the same amount as what I’ve collected from the call I wrote. (In this example I’ve collected 15.00 points ($750.00) on the call, the put protection premium should cost me approximately 15.00 points  ($750.00).

2.7) Purchase the 2,450.00 put with the same expiration date for 17.00 points ($850.00).

2.8) The put objectively defines my risk on the 2,500.00 long position for the duration of the trading period (entry date 15 September 2017 to 13 October 2017 expiration)

2.9) The put also negates any possibility of this position being stopped out for the duration of the trading period.

2.10) Summary
Long a futures contract at 2,500.00
Collected on the 2,550.00 call write, 15.00 points at the profit objective
Paid out on the 2,450.00 put purchase -17.00 points to objectively define risk

Net cost of the hedge = 2.00 points or $100.00,  which defines risk on a contract worth $125,000 from the 14th of September 2015 until  the 13th of October 2017. 

3) Potential outcomes

3.1) The market stays the same and settles on the 13th of October 2017 at 2,500.00 unchanged from entry.

3.2) Trade Result

The call we wrote at 2,550 expires worthless, +15.00 points = +$750.00

The 2,500.00 long futures settles unchanged at 2,500.00 = $0.00

The 2,450 put purchased expires worthless, we lose 17.00 points = -$850.00

Total bid/ask spreads, commission, exchange & regulatory fees =-$159.78

All in net profit or loss = -$259.78

3.3) The market moves hard against us

The market drops from our entry price of 2,500.00 (contract value = $125,00.00) down 600.00 points -24.00% to 1,900.00 contract value $95,000 in “fast market action“.

If a percentage drop like this occurred, it would have no impact on the maximum risk of this collared position because we own the put.

The maximum risk (in this example) is the distance between our entry at 2,500.00 contract value $125,000.00 to where the put engages at 2,450.00, contract value $122,250.00, maximum loss $2,500.00 regardless if this market moves to zero.

3.4) Trade Result

Loss on the 2,500.00 long futures position (600.00) points = -$30,000.00

The call we wrote at 2,550.00 expires worthless +15.00 points =+$750.00

The put we own at 2,450.00 is profitable 533.00 points =+$26,650.00

Total bid/ask spreads, commission, exchange & regulatory fees =-$159.78

All in net loss = -$2,759.78

A $100.00 hedge prevented a potential loss on this position of $30,000.

3.5) The market moves higher in our favor 

The established trend continues higher  from our long entry of 2,500.00 contract value $125,000 to our profit objective of 2,550.00 contract value $127,500 on or before the 13th of October 2017.

3.6) Trade Result

Gain on the 2,500.00 long futures position 50.00 points = +$2,500.00

The covered call we wrote at 2,550.00 is offset by the futures, we also keep the 15.00 points in collected premium =+$750.00

The put we own at 2,450.00 expires worthless -17.00 points =-$850.00

Total bid/ask spreads, commission, exchange & regulatory fees =-$159.78

All in net profit or loss = $2,240.22.

4) Procedure for short positions

4.1) On the 1st of  February 2018 (TIP) Trend identification procedure linked here  is telling you the S&P is in a short-term downtrend and to structure a short trade for 2 to 10 days.

We enter a short futures position at 2,815.00
Contract value $140,750.00

4.2) Determine the profit objective

To simplify I am continuing the angle of the slope on the short-term EMA9 chart out 10 days to generate a profit objective of 2,740.00

Profit objective at 2,740.00
Contract value $137,500.00

5) Collar procedure

Short futures on 2 February 2018 at 2,815 (contract $140,750.00)

5.1) I write an out of the money, put option against my 2,815.00 short futures position at the strike price that is closest to the profit objective, in this example 2,740.00

5.2) I choose an options expiration that is consistent with the TIP  defined trade duration (in this example the 9th of February 2018).

5.3) When I write an out of the money option against my short position I collect option premium, in this example I’ve collected 27.00 points or +$1,350.00.

Objectively Defining Risk

5.4) Using the collected premium of 27.00 points or +$1,350.00 from the sale of the 2,740.00 put I buy a call option.

5.5) The call option purchased must have the same option expiration as the put I wrote (in this example the 9th of February 2018).

5.6) The option premium price paid for the call option should be approximately the same amount or less than what I’ve collected from the put write (in this example I collected 27.00 points or +$1,350.00).

5.7) The call strike price should be approximately the same amount from entry. In this example I’m short futures at 2,815.00 , I written an out of the money put at my profit objective 75.00 points below my 2,815 short entry , the call I purchase should be at a strike of 2,815.00 + 75.00 = 2,890.00 or lower.

5.8) I purchase the 2,890.00 call with an expiration date of the 9th of February 2018 for 16.00 points  or –$800.00.  

5.9) The call objectively defines risk on my 2,815.00 short position for the duration of the trading period (entry date 2nd of February 2018 to the 9th of February 2018 expiration)

5.10) The call negates any possibility of this position being stopped out for the duration of the trading period.

5.11) Summary

Short a futures contact at 2,815.00
On the put write at my profit objective of 2,740.00 I’ve collected 27.00
I’ve paid out 16.00 points on the 2,890.00 call to objectively define my risk

Net cost of the hedge = +9.00 points or $550.00,  in this example we I’m getting  paid to define risk on a contract worth $140,750 from the 2nd of February 2018 to the 9th of February 2018 . 

6) Potential outcomes for this trade

6.1) The market stays the same and settles on the 9th of February 2018  unchanged from our entry at 2,815.00.

6.2) Trade Result

The put wrote at 2,740.00 expires worthless, I keep the 27.00 points = $1,350.00

The 2,815.00 short futures settles unchanged at 2,815.00 = $0.00

The 2,890.00 call purchased expires worthless, I lose 16.00 points = -$800.00

Total bid/ask spreads, commission, exchange & regulatory fees = -$159.78

All in net profit or loss  = +$390.22

6.3) The market moves hard against us

The market rallies from my short entry at 2,815.00 (contract value = $144,500.00)  300.00 points +10.66% to 3,115.00 contract value $155,750 in “fast market“ action.

If a  rally like this occurred it would have no impact on the maximum risk of this collared position because I own the call.

The call objectively defines my risk on the this short position for the duration of the trading period. The maximum risk (in this example) is the distance between my entry at 2,815.00 contract value $140,750.00 to where the call engages at 2,890.00 contract value $144,500.00

6.4) Trade Result

Loss on the 2,815.00 short futures position 300.00 points = -$15,000.00

The put I wrote at 2,7400 expires worthless +27.00 points =+$1,350.00

The call I own at 2,890.00 is profitable by 209.00 points =+$10,450.00

Total bid/ask spreads, commission, exchange & regulatory fees = -$159.78

Net loss = -$3,359.78.78

In this example I was paid $+550.00 to prevent a potential loss of $15,000

6.5) Market moves lower in my favor

The trend continues lower from my short entry at 2,815.00 on the 1st of February 2018 contract value $140,750.00 to my profit objective of 2,740.00 contract value $137,000 on or before the 9th of February 2017.

6.6) Trade Result

Gain on the 2,815.00 short futures position 75.00 points = $3,750.00

The put I wrote at 2,740.00 is offset by the short futures position, I keep the +27.00 points in collected option time premium = +$1,350.00

The call I purchased at 2,890.00 expires worthless -18.00 points = -$800.00

Total bid/ask spreads, commission, exchange & regulatory fees = -$159.78

All in net gain or loss = $4,140.22

7) S&P Collar Spreadsheet

  • Open with Excel
  • Click OK
  • Enable editing
  • Enable content

If you have questions or need help with this procedure please schedule an online review or send me a message

Regards,
Peter Knight Advisor
Contact

____________________________________________________________________________

Privacy Notice

Disclosure


Defining Trend, Reversals, Trade Duration & Number of Contracts Traded

This program trades up to 5 S&P E-mini contracts per $25,000 trading unit with the trend up or down using defined risk strategy. The Gold ATA and Currency ATA’s use the same methodology.

  • Up to 2 short-term positions with a trade duration of 2 to 10 days
  • Up to 2 medium-term positions with a trade duration of 11-29 days
  • Up to 1 long-term position, trade with a duration of 30 to 90 days
  • Total margin requirement never exceeds $12,500 USD per $25,000 USD  trading unit because all trades are fully hedged.

1) Trend Identification Procedure (TIP)

1.1) Looking at the 1983 to 2018 chart below and linked here does it really look that hard to identify the major up or downtrends over the last 35 years?

1.2) One quick and reliable indicator out of the 12 this program uses is an Exponential Moving Average 9 (EMA9).

On the 2000 to 2013 chart below and linked here I’ve dropped in an EMA9 represented by the red line.

1.2) Whatever data period you’re using, 3 minutes to 3 months if price action is below the (EMA9) it’s telling you the market is in a downtrend.

1.3) If price action is above the (EMA9) an uptrend

1.4) By itself you’ll find the EMA9 a quick and reliable way to initially qualify a market’s trend.

Below I’ve linked every Bull and Bear market since 1983 enabling you to review the accuracy of the EMA9 as an indicator. These charts should also clarify the need to trade the market both long or short to maximize profitability.

1.5)  1983-2018 chart 
1.6) January 1983 – August 1987  Bull 139.72 – 337.89 =+141.83%
1.7) August 1987 – October 1987 Bear 337.89 – 216.47 =-35.94%
1.8) August 1987 – August 1989  Bear to recovery (2 years)

1.9) August 1987 – July 1990  Bull 216.47 – 369.78 = +70.82%
1.10) July 1990  October 1990  Correction  369.78 – 294.51 =-20.36%
1.11) July 1990 – February 1991  Correction to recovery (7 months)

1.12) October 1990 – July 1998  Bull 294.51 – 1,190.58 =+304.26%
1.13) July 1998 – October 1998 Correction 1,190.58 – 923.52 =-22.43%
1.14) July 1998 – November 1998  Correction to recovery (4 months)

1.15) October 1998 – March 2000 Bull 923.52 – 1,552.87 =+68.15%
1.16) March 2000 October 2002  Bear 1,52.87 – 768.63 =-50.50%.
1.17) March 2000 December 2007 Bear to recovery (7 years 9 months)

1.18) October 2002 – October 2007   Bull 768.63 – 1,576.09 =+105.05%
1.19) October 2007 –  March 2009  Bear 1,576.09 – 666.79 =-57.70%
1.20) October 2007-  April 2013  Bear to recovery (5 years 6 months)

1.21) March 2009 – January 2018  Bull 666.79 – 2,872.87 = +327.87%

2) Once you’ve initially qualified the trend using the EMA9 confirm the trend using the overall average of the indicators linked here.

3) Specific examples 

3.1) Short-term trades with a trade duration of 2 to 10 days

In the example below is the daily price action above or below the EMA9?

Above the EMA9 = buy
Below the EMA9 = sell

Below, the short term trend is down

3.3) Confirm the EMA9 short-term trend using the overall average and the short-term technical opinion.

In this example the overall average is a 48% sell
The average of the 5 short-term indicators is a 60% sell

3.4) If the EMA9, overall average and short-term average indicators all agree short-term trades of 2 to 10 days in duration are permitted

Example,

EMA9 = sell
Overall average = 48% sell
5 short-term indicators = 60% sell

If you’re already short the market, short-term trades can be maintained, if you’re long reverse to short.

This program trades up to 2 short-term positions per $25,000 trading unit.

3.5) Short-term, short futures positions with a duration of  2 to 10 days 

If the overall average and short-term average indicators are less than a 50%  sell you are not permitted to add a second position

Example,

Overall average =  65% sell
5 short-term indicators =  40% sell
Does not permit adding a second contract 

If the overall average and short-term average indicators are both greater than a 50% sell you are permitted to add a second position

Example,

Overall average = 53% sell

5 short-term indicators = 60% sell
Permits a second contract  

3.6) Short-term, long futures positions with a duration of  2 to 10 days 

If the overall average of short-term average indicators are less than a 50%  buy you are not permitted to add a second position

Example,

Overall average = 60% buy
5 short-term indicators = 35% buy
Does not permit a second contract

If both the overall average and short-term average indicators are greater than a 50% buy you are permitted to add a second position

Example,

Overall average = 53% buy
5 short-term indicators = greater than  60% buy
Permits a second contract

3.7) If the EMA9, overall-average and short-term average indicators do not  agree liquidate to neutral.

Example,

EMA9 using daily data = buy (price action is above the EMA9)
Overall average = 27% Buy 
5 short-term indicators = 8% sell
Liquidate

Try to identify today’s short-term trend 

3.6) Today’s EMA9 (using daily data)

  • Is price action above or below the EMA9?
  • Above = BUY
  • Below = Sell

3.7) Today’s Technical (Opinion)

  • Does the overall average agree with the EMA9?
  • Does the average of the 5 short-term indicators agree with the EMA9?
  • If they all agree positions are permitted
  • If the overall average and short-term indicators are greater than 50% a second position is permitted
  •  If they disagree liquidate to neutral

3.8) Once trend is defined “collar” the trade, using this procedure.

  • Collars objectively define risk on the trade and for the duration of the trading period
  • Collars eliminate any possibility of the position being stopped out
  • Collars eliminate the possibility of a margin call (because risk is objectively defined when the trade is established)
  • In most cases collars reduce your margin requirement, if the maximum risk on the trade is $1,800.00 and the exchange margin requirement is $5,050.00, the margin requirement would be the lower of the 2, in this example the margin requirement would be the maximum trade risk of $1,800.00.
  • Properly set up a collar is premium neutral (does not waste investment capital on excessive purchases of option time premium to define risk)

4) Medium-term trades with a duration of 11 to 29 days

4.1) The rules are the same as the short-term but you’re using an EMA9 on weekly price action versus daily

4.2) Confirm the EMA9 medium-term trend using the overall average  and medium-term average of technical opinions.

In this example the overall average is a 48% sell
The average of the 5 short-term is a 50% sell

Try to identify today’s medium-term trend

4.3) Today’s EMA9  (using weekly data) 

  • Is price action above or below the EMA9?
  • Above = BUY
  • Below = Sell

4.4) Today’s indicators (Opinion)

  • Does the overall average agree with the EMA9?
  • Does the average of the 4 medium-term indicators agree with the EMA9?
  • If they all agree positions are permitted
  • If the overall average and medium-term indicators are greater than 50% a second position is permitted
  •  If they disagree liquidate to neutral

4.5) Once a trend is defined “collar” the trade, using this procedure.

5) Long-term trades with a duration of 30 to 90 days

5.1) The rules are the same as the short-term but you’re using an EMA9 on monthly price action versus daily or weekly.

5.2) Confirm the EMA9 long-term trend using the overall  average and long-term Average technical opinions.

In the example below, the overall average was a 48% sell, the long-term indicators are generating a hold, no new long-term trades would  be permitted.

5.3) This program trades a maximum of 1 long-term position per $25,000 trading unit.

Try to identify today’s long-term trend

5.4) Today’s EMA9  (using monthly data)

  • Is price action above or below the EMA9?
  • Above = BUY
  • Below = Sell

5.5) Today’s indicators (Opinion)

  • Does the overall average agree with the EMA9?
  • Does the average of the 3 long-term indicators agree with the EMA9?
  • If they all agree positions are permitted
  •  If they disagree liquidate to neutral

5.6) Once trend is defined collar the trade, using this procedure.

6) To demonstrate the durability of the EMA9 and Opinion try using them on the related and unrelated markets linked below.

6.1) Last 10 EuroStoxx  
6.2) Opinion
6.3) Last 10 FTSE 100 monthly O/H/L/C
6.4) FTSE opinion
6.5) Last 10 DAX Index monthly O/H/L/C
6.6) DAX Index opinion
6.7) Last 10 Gold monthly O/H/L/C
6.8) Gold opinion
6.9) Last 10 Euro monthly O/H/L/C
6.10) Euro opinion
6.11) Last 10 British Pound monthly O/H/L/C
6.12) British Pound opinion
6.13) Last 10 Australian dollar monthly O/H/L/C
6.14) Australian Dollar opinion
6.15) Last 10 Canadian dollar monthly O/H/L/C
6.16) Canadian Dollar opinion
6.17) Last 10 Brazilian Real monthly O/H/L/C
6.18) Brazilian Real opinion
6.19) Last 10 Russian Ruble monthly O/H/L/C
6.20) Russian Ruble opinion
6.21) Last 10 on 2 year US Treasuries monthly O/H/L/C
6.22) 10 Year Treasury opinion
6.23) Last 10 Euro Bund  monthly O/H/L/C
6.24) Euro Bund opinion
6.25) Last 10 NY Crude Oil monthly O/H/L/C
6.26) Crude Oil opinion
6.27) Last 10 Copper monthly O/H/L/C
6.28) Copper opinion
6.39) Last 10 Lumber monthly O/H/L/C
6.30) Lumber opinion
6.31) Last 10 Cotton monthly O/H/L/C
6.32) Cotton opinion
6.33) Last 10 Orange Juice monthly O/H/L/C
6.34) Orange Juice opinion

Identifying the trend is only 1/3rd of the battle to win the war of becoming a profitable trader, the other 2/3rds is how you structure your trades.

For full disclosure of how we set profit objectives and define risk on every trade and for the duration of every trading period see this link.

If you have questions send us a message or schedule an online review .

Regards,
Peter Knight Advisor

—————————————————————-

Privacy Notice

Disclosure


Bull & Bear Markets 1983 through 2019

1)_Major/Minor Bull, Bear Markets 1983 to 2019

1.1) 1983-2018 chart
1.
2)  January 1983 – August 1987 Bull 139.72 – 337.89 =+141.83%
1.3)  August 1987 – October 1987 Bear 337.89 – 216.47 =-35.93%
1.4)  August 1987 – August 1989 Bear to recovery (2 years)
1.5)  August 1987 – July 1990 Bull 216.47 – 369.78 = +70.82%
1.6)  July 1990 October 1990 Correction 369.78 – 294.51 =-20.36%
1.7)  July 1990 – February 1991 Correction to recovery (7 months)
1.8)   October 1990 – July 1998 Bull 294.51 – 1,190.58 =+304.26%
1.9)   July 1998 – October 1998 Correction 1,190.58 – 923.52 =-22.43%
1.10) July 1998 – November 1998 Correction to recovery (4 months)
1.11) October 1998 – March 2000 Bull 923.52 – 1,552.87 =+68.15%
1.12) March 2000 October 2002 Bear 1,52.87 – 768.63 =-50.50%
1.13) March 2000 December 2007 Bear to recovery (7 years 9 months)
1.14) October 2002 – October 2007 Bull 768.63 – 1,576.09 =+105.05%
1.15) October 2007 – March 2009 Bear 1,576.09 – 666.79 =–57.68%
1.16) October 2007- April 2013 Bear to recovery (5 years 6 months)
1.17) March 2009 – January 2018 Bull 666.79 – 2,872.87 = +330.87%
1.18) January  2018 – February 2019  2,872.87 – 2,785.50 = -3.04%

2) The Importance of Trading Long and Short (3:23)

3) Video Reference Links

3.1) Full Disclosure of trading Methodology
3.2) All Bull & Bear Markets 1983 to 2018
3.3) Excel Spreadsheet  1927-2018 historical data and inflation  adjusted
3.4) U.S. Stock Index futures we trade
3.5) European Stock Index futures we trade 
3.6) Asian Stock Index Futures
3.7) Why Trade Futures Instead of ETFs?
3.8) A Cost Comparison – Futures versus ETFs
3.9)
Top 100 Exchange Traded Funds (ETFs)

4) 1927 to 2018

5) 1927 to 2018 inflation adjusted prices

6) This link will give you the 1927-2018 historical data for actual and inflation  adjusted prices  (excel file).

If you have questions send us a message or schedule an online review .

Regards,
Peter Knight Advisor

—————————————————————-

Privacy Notice

Disclosure


About S&P Futures Contracts

Stock Index Education Home Page

If you’re not familiar with futures contracts they are agreements to buy or sell at an agreed price on or before an agreed date.

Long = own the contract anticipating the price to move higher, once a long position is established it has to be sold on or before the contract delivery date, for example an ESH18  contract has to be offset or before March 16th 2018.

Short = Owe the contract, selling a contract you do not own, once a short position is established it has to be bought back on or before the delivery date, Trading futures there is no dividend delivery, no short squeezes.

Contract value = $50 X the index, (an index at 2,825.00 = $141,250.00)
Bid/ask spread 0.25 = $12.50 , contract value = $141,250.00 at 2,825.00
Margin requirement = $5,050.00 (1/28th of contract value)
Margin call, if your balance falls below the margin requirement
Carry cost built into forward pricing  (current leverage cost 0.73% annually)
Trade cost, $26.60 or less per contract (includes all fees)
Contract volume, 130+ billion USD daily, liquid underlying options market

One click lets you go long or short a contract that mirrors the S&P index (worth $141,250.00 at 2,825.00) with as little as $5,050 in your account.

Long short flexibility

A 23.75 hour trading day and 130+ billion USD in daily liquidity make it very easy on days like 2nd and the 5th of February 2018 to hedge an existing portfolio or capture the move lower.

Contract value is based on these 500 stocks

Quotes, charts and analysis for all 500 stocks
SEC filings & information for all 500 stocks

Trading Hours
CME Globex: Sunday – Friday 6:00 p.m. – 5:00 p.m. Eastern Time (ET) with  trading halt 4:15 p.m. – 4:30 p.m. Clearport: Sunday – Friday 6:00 p.m. – 5:00 p.m. ET

Margin Requirement

Product Code
CME Globex: ES

CME ClearPort: ES
Clearing: ES

Listed Contracts
Four months in the March Quarterly Cycle (Mar, Jun, Sep, Dec)

Termination Of Trading
9:30 a.m. ET on the 3rd Friday of the contract month

Position Limits (excel file)  

Exchange Rulebook

If you have questions send us a message or schedule an online review .

Regards,
Peter Knight Advisor

—————————————————————-

Privacy Notice

Disclosure

The basics of futures contracts

The basics of futures contracts, how contracts trade on a futures exchange, the different ways customers use these instruments and the benefits that futures provide. Gain a stronger understanding of how futures work and why more market participants are using derivatives in their trading strategies today.

1) Definition of a Futures Contract

2) Learn About Contract Specifications
3) Understanding Contract Trading Codes
4) Get to Know Futures Expiration and Settlement
5) Tick Movements: Understanding How They Work
6) What are Price Limits and Price Banding
7) About Contract Notional Value
8) Mark-to-market
9) Margin: Know What’s Needed
10) Understanding Futures Expiration & Contract Roll
11) Price Discovery
12) Calculating Futures Contract Profit or Loss
13) Understanding the Role of Speculators
14) Understanding the Role of Hedgers
15) Trading venues (pit vs online)
16) Midwest Grain Trade: History of Futures Exchanges
17) Futures Contracts Compared to Forwards

If you have questions or comments send us a message or  schedule an online review and we’ll contact you to answer your questions and provide supporting links for additional information and/or verification.

—————————————————————-

Disclosure

Equity Index Daily & Final Settlement

Stock Index Education Home Page

Equity Index Daily & Final Settlement

When trading Equity Index futures, there are two types of settlement: daily and final.

Daily settlement refers to the contract’s settlement price on a daily basis while final settlement represents the final value of the contract at expiration

Futures markets are marked to market every day, a benefit that means every market participant sees the same settlement price at the same time as every other participant.

Daily Settlement

For most Equity Index futures, daily settlement price for the front month is calculated using a volume weighted average price (VWAP) based on the last 30 seconds of the trading day.

In the case of the E-Mini NASDAQ-100 futures contract, the average would be based on trading activity on CME Globex between 15:14:30 – 15:15:00 Central Time.

Traders, brokers, and others market participants use daily settlement information to manage daily profit and loss, as well as to possibly adjust their margin levels with their clearing firms.

Final Settlement

When it comes to final settlement for U.S.-based Equity Index contracts, the value is determined using a Special Opening Quotation, known as the SOQ.

The SOQ is determined by the index provider and is calculated using the actual opening prices for each of the underlying constituent stocks.

In the case of S&P500® futures, the SOQ is determined by the first traded price for each of the 500 companies’ shares that make up the index.

This number is calculated by the Standard and Poors Corporation and generally made available the third Friday of every quarterly futures contract month.

If you have questions send us a message or schedule an online review .

Regards,
Peter Knight Advisor

—————————————————————-

Privacy Notice

Disclosure


Stock Index Educational Videos & Links

1) General Information on Futures and Futures Options

1.1) Futures  Educational Videos (60)
1.2) Futures Options Educational Videos (34)

2) S&P Educational Videos

2.01)   What is a Futures contract?
2.02)   What is an Equity Index Futures
2.03)   About S&P Futures and Contract Specifications
2.04)   Definition of Margin
2.05)  
The Benefits of Futures Margins

2.06)   Fundamentals and Equity Index Futures
2.07)
  Who Uses Equity Index Products?

2.08)   Why Trade Futures instead of ETFs?
2.09)
  Hedging and Risk Management for Equity Index Futures 

2.10   Trading Opportunities in Equity Index Futures
2.11)  Other Opportunities in Equity Index Futures

2.12)  How to Trade Select Sectors
2.13) 
Explaining Call Options (Short and Long)
2.14)  Explaining Put Options (Short and Long)
2.15)  Trading Options During Economic Events
2.16) Option Collars what they are and the basics of how they work
2.17)  Working Example of Collaring a Position
2.18)  Equity Index Daily & Final Settlement

2.19)  Rolling an Equity Position Using Spreads
2.20)  What is Equity Index Basis?
2.21)  Equity Index Notional Value and Price
2.22)  The Importance of Depth (Volume)
2.23)  Equity Intermarket Spreads
2.24)  Implied Liquidity in Select Sector Futures
2.25
)  Influence of Pricing on the Option for Equity Traders

2.26)  Why Options on Futures Gives Added Benefit of Diversifying Risk
2.27)  Alpha/Beta and Portable Alpha
2.28)  Cash Equitization – Cash Drag in the Cross Hairs
2.29)  Transition Management using Stock Index Futures
2.31)  Beta Replication and Smart Beta
2.31)  Additional Educational Information on Stock Indices

If you have any questions, contact me.

Peter Knight
Voice & Video Chats.
Message me


Disclosure

Understanding Implied Liquidity in Select Sector Futures

Stock Index Education Home Page

Understanding Implied Liquidity in Select Sector Futures

Liquidity for equity index futures is often measured by what investors can see quoted or traded on-screen. If the central limit order book (CLOB) displays a wide bid-ask spread or shows small size, you may incorrectly conclude that the contract is illiquid. However, with the multitude of ways to trade futures, such as through the CLOB, Basis Trade at Index Close, Block Trades or Exchange for Physicals, you can tap into additional sources of liquidity.

Finding Additional Sources of Liquidity

Consider, a fund manager that needs to trade $25 million in the Financial Select Sector Index intraday, and prefers to trade capital efficient futures. The manager calculates a need to buy 425 XAF contracts to achieve the desired exposure. The manager sees a three-tick wide market on 15 contracts and notices that XAF trades ~300 contracts per day on average. While realizing that working the order may take too long and may result in price slippage, the manager contacts his/her broker or a futures’ block liquidity provider, and indicates interest in a block trade.

BLOCK TRADE

A futures block trade allows participants the flexibility to privately negotiate larger transactions at fair and reasonable prices. The dealer will most likely provide a market based on the liquidity of the underlying single-stock index constituents or the corresponding ETF. By taking advantage of the activity in adjacent markets, the block provider may quote prices on quantities, more than what could be seen on the futures CLOB. In this case, for a $25 million Financial Select Sector futures block trade, the dealer could easily combine its hedge from the nearly $30 billion that trades daily in the underlying stocks and the corresponding ETF market.

BASIS TRADE AT INDEX CLOSE (BTIC)

When participants seek intraday liquidity via blocks, the tightness and size of markets can be affected by the dealer’s ability to hedge the associated risk in the continuous cash market. One way to access additional liquidity for size is to align the futures block execution against the close, to leverage the volume transacted in the index component market-on-close (MOC) auctions. The best way to achieve this alignment is to utilize BTIC block trades. A BTIC block trade enables investors to trade futures at a negotiated spread to the underlying cash index official close and thus provides participants price and size certainty.

To execute a BTIC block, a fund manager needs to reach out to a liquidity provider and negotiate the fair value spread, or basis, of the futures to the Index, say -1.50 index points. The dealer may hedge the BTIC futures trade by buying the required number of shares per component in each stock’s respective MOC auction and perfectly replicating the cash index closing value. If the official index close was 241.5, the 425 futures contracts would be executed at 240.00 via the BTIC block. This enables a fund manager to execute a full order in one trade with price certainty, and encourages a dealer to trade more size via BTIC as a result of the hedge certainty provided by transacting stock in the MOC auction.

EXCHANGE FOR PHYSICAL (EFP)

A third way to access futures exposure is by tapping into the liquidity of the ETF market and then converting the ETF position into futures via an Exchange For Physical (EFP) transaction. EFP transactions are also privately negotiated.

For example, a fund manager purchased ~1 million shares of the Financial Select Sector ETF at a price of $25 to use liquidity in the ETF market, the fund manager could then negotiate an EFP with a dealer to exchange the ETFs for an equivalent futures position using E-mini Financial Select Sector Futures contracts.

Summary

The complete liquidity profile for a futures contract is dependent on the availability of equivalent and substitute products that market makers can use to price and hedge the futures, as well as the availability of exchange mechanisms such as blocks, BTIC and EFPs that can be used to access the contracts. CME Group offers exposure to benchmark equity indices where both on- and off-screen liquidity can be accessed to best meet your risk management needs.

If you have questions send us a message or schedule an online review .

Regards,
Peter Knight Advisor

—————————————————————-

Privacy Notice

Disclosure