
In the United States, the federal funds rate is the interest rate at which institutions actively trade balances held at the Federal Reserve.
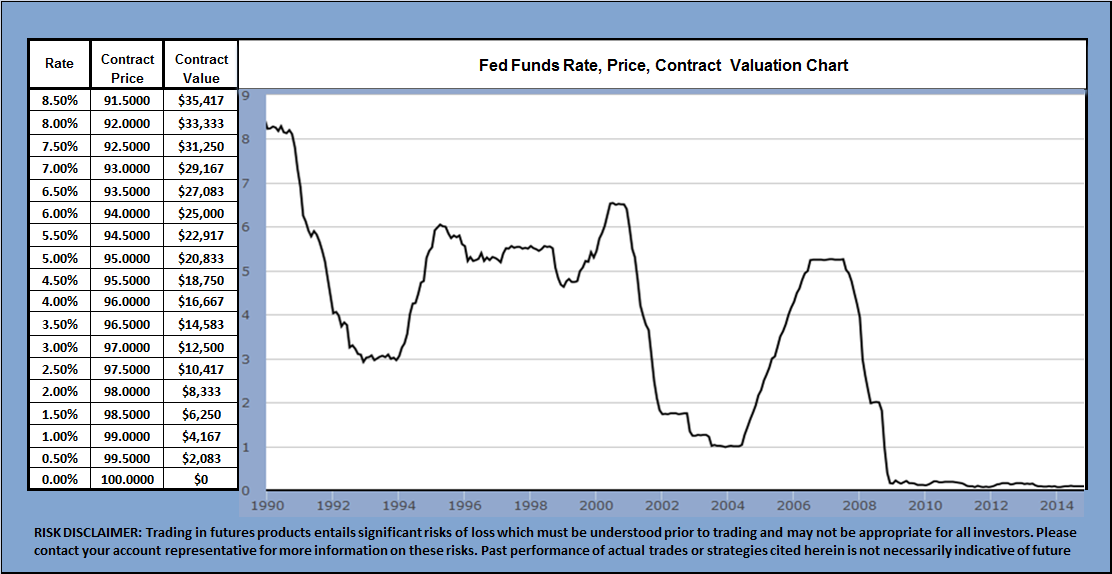
Click here to enlarge the chart below
Click here for a current chart and historical data

How Fed Funds Trade
Institutions with surplus balances in their accounts lend those balances to institutions in need of larger balances. The interest rate that the borrowing bank pays is negotiated between the two banks, and the weighted average of this rate across all such transactions is the federal funds effective rate.
The federal funds target rate is determined by a meeting of the members of the Federal Open Market Committee which normally occurs eight times a year about seven weeks apart. The committee may also hold additional meetings and implement target rate changes outside of its normal schedule.
Click here for the names of the individuals that determine rates.
Click here for the 12 regional Federal Reserve Banks and their presidents.
Click here for the F.O.M.C. meeting and post meeting press conference schedule.
Click here Bloomberg interactive Fed Funds rate chart.
Click here for the 1954-2013 Fed Funds rate chart and historical price data from the Federal Reserve
The Federal Reserve uses open market operations to influence the supply of money in the U.S. economy to make the federal funds effective rate follow the federal funds target rate.
U.S. banks and thrift institutions are obligated by law to maintain certain levels of reserves, either as reserves with the Fed or as vault cash. The level of these reserves is determined by the outstanding assets and liabilities of each depository institution, as well as by the Fed itself, but is typically 10% of the total value of the bank’s demand accounts (depending on bank size). In the range of $9.3 million to $43.9 million, for transaction deposits (checking accounts, NOWs, and other deposits that can be used to make payments) the reserve requirements are 3 percent of the end-of-the-day daily average amount held over a two-week period. Transaction deposits over $43.9 million held at the same depository institution are carried a 10 percent reserve requirement.
For example, assume a particular U.S. depository institution, in the normal course of business, issues a loan. This dispenses money and decreases the ratio of bank reserves to money loaned. If its reserve ratio drops below the legally required minimum, it must add to its reserves to remain compliant with Federal Reserve regulations. The bank can borrow the requisite funds from another bank that has a surplus in its account with the Fed. The interest rate that the borrowing bank pays to the lending bank is negotiated between the two banks and the weighted average of this rate across all such transactions is the federal funds effective rate.
The nominal rate is a target set by the governors of the Federal Reserve which they enforce primarily by open market operations. That nominal rate is almost always what is meant by the media referring to the Federal Reserve “changing interest rates.” The actual Fed funds rate generally lies within a range of that target rate, as the Federal Reserve cannot set an exact value through open market operations.
Another way banks can borrow funds to keep up their required reserves is by taking a loan from the Federal Reserve itself at the discount window. These loans are subject to audit by the Fed, and the discount rate is usually higher than the federal funds rate. Confusion between these two kinds of loans often leads to confusion between the federal funds rate and the discount rate. Another difference is that while the Fed cannot set an exact federal funds rate, it can set a specific discount rate.
The federal funds rate target is decided by the governors at Federal Open Market Committee (FOMC) meetings. The FOMC members will either increase, decrease, or leave the rate unchanged depending on the meeting’s agenda and the economic conditions of the U.S. It is possible to infer the market expectations of the FOMC decisions at future meetings from the Chicago Board of Trade (CBOT) Fed Funds futures contracts, and these probabilities are widely reported in the financial media.
Applications
Interbank borrowing is essentially a way for banks to quickly raise liquidity. For example, a bank may want to finance a major industrial effort but not have the time to wait for deposits or interest (on loan payments) to come in. In such cases the bank will quickly raise this amount from other banks at an interest rate equal to or higher than the Federal funds rate.
Raising the federal funds rate will dissuade banks from taking out such inter-bank loans, which in turn will make cash that much harder to procure. Conversely, dropping the interest rates will encourage banks to borrow money and therefore invest more freely. Thus this interest rate acts as a regulatory tool to control how freely the US economy operates.
By setting a higher discount rate the Federal Bank discourages banks from requisitioning funds from the Federal Bank, yet positions itself as a lender of last resort.
Comparison with LIBOR
Though the London Interbank Offered Rate (LIBOR) and the federal funds rate are concerned with the same action, i.e. interbank loans, they are distinct from one another, as follows:
- The target federal funds rate is a target interest rate that is set by the FOMC for implementing U.S. monetary policies.
- The (effective) federal funds rate is achieved through open market operations at the Domestic Trading Desk at the Federal Reserve Bank of New York which deals primarily in domestic securities (U.S. Treasury and federal agencies’ securities).
- LIBOR is calculated from prevailing interest rates between highly credit-worthy institutions.
- LIBOR may or may not be used to derive business terms. It is not fixed beforehand and is not meant to have macroeconomic ramifications.
If you have questions send us a message or schedule an online review .
Regards,
Peter Knight Advisor
—————————————————————-


