

Opinion 20 Year Chart 5 Year Chart Daily Chart
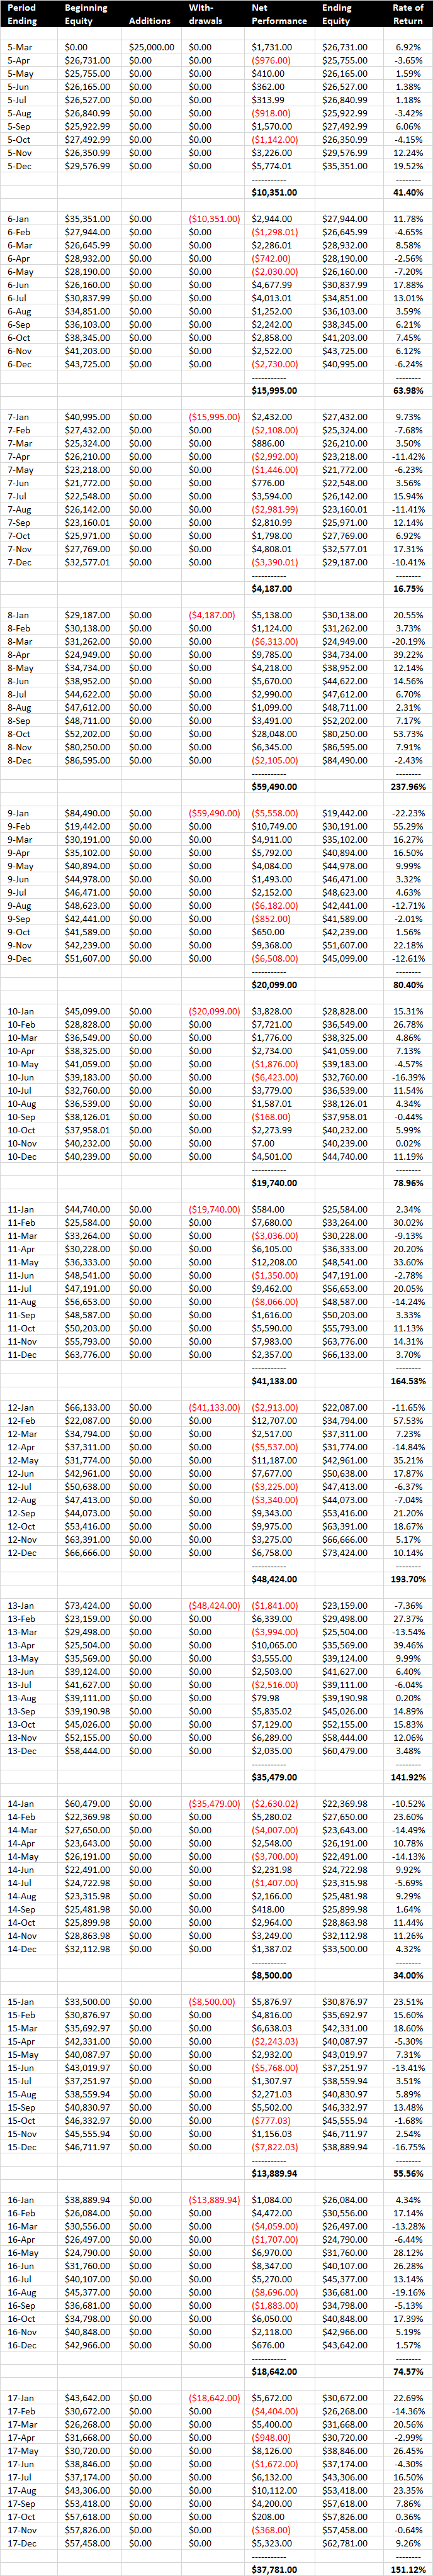
1) Performance March 2005 through December 2017
| Recommended Starting Balance | $25,000.00 |
| Cumulative Net Profit |
$333,710.94 |
| Maximum Drawdown (49.10%) |
($12,276.00) |
| Best Year 2008 +237.96% | $59,490.00 |
| Worst Year 2007 +16.75% | $4,187.00 |
| 2005-2017 Average +104.01% | $26,003.45 |
| 2017 +151.12% |
$37,781.00 |
1.1) Performance
1.2) Monthly and Annual Performance
2) Automated Trading Accounts (ATA’s) what they are and how they work (3 minutes 39 seconds)
2.1) As our ATA Client you maintain control of
- The market(s) you trade and when
- The methodologies you trade
- The level of leverage that suits your risk tolerance
- The overall risk for your account
2.2) ATA Team responsibilities include
- Calculating entries, trade risk levels and profit objectives
- Placing all orders and diligently overseeing executions, positions and balance
- Monitoring total account risk to ensure it is within your defined guidelines
- Ensuring everything is done correctly and assuming liability if it’s not
- Answering all your questions on markets and methodologies
2.3) About this ATA
- This ATA uses fully disclosed trading methodology
- Trades with the trend long or short
- Uses option collars that define risk on every trade and duration of every trading period
- Trades in this ATA cannot be stopped out regardless of market volatility
- The only way a position can be called away is at a profit
- If the market stays the same this ATA hasn’t wasted precious investment capital on purchasing option time premium as it is collecting approximately as much time premium on the covered writes (at the profit objectives), as it’s paying out on the purchased options that define maximum trade risk
- Option collars can be offset at any time locking in gains and/or modified to capture more of the move or, reversed to capture a trend reversal
- Mark-to-market positions and balance are available online at any time
- Statements are emailed daily disclosing positions, liquidating value and any trading activity
- Monthly statements summarize all activity and end of month balance
- Liquidity for ATA accounts in portion or all is 2 to 48 hours in any major currency
- AIM ATA’s afford you the opportunity to modify markets, units you trade and your overall account risk level at any time
- Gold Quotes and essentials for trading
- Additional Gold guides, reports and videos
- Other markets we trade ATA’s on in North America and Europe
- Contact us with your questions
- Schedule an online review
3) Disclosure of Trading Methodology (25 minutes 4 seconds) (automated software is available to qualified clients)
3.1) Spreadsheet and instructions to track, duplicate trades, or generate your own.
- Gold Collar Spreadsheet
- Set to open with Excel
- Click OK
- Enable editing
- Enable content
- Play the instructional video embedded in the top center of spreadsheet (some browsers and/or versions of excel do not allow this, if you have difficulties the spreadsheet instructions start at 9:35 in the video above)
4) Gold Trading Tools
4.1) Gold Collar Spreadsheet
4.2) Gold contract specifications and information
4.3) Opinion
4.4) 1 Year chart using daily price data
4.5) 5 Year chart using weekly price data
4.6) 20 Year chart using monthly price data
4.7) Analysis 1
4.8) Analysis 2
4.9) Ranges
4.10) CME Futures Quotes
4.11) CME Options Quotes
4.12) Barchart Options Quotes
5) Defining risk for your Automated Trading Account (ATA)
(5 minutes 4 seconds)
5.1) AIM Advisory & Risk Control Agreement
5.2) Risk Control Agreement
- Allows you to set a stop loss for your account based on the liquidation value of the account ( maintenance balance)
- Should the account fall below your defined maintenance balance as of the settlement on any trading day our team will automatically liquidate all positions on or before the next settlement and report back to you.
- If we fail to liquidate on or before the next settlement we would liable for any losses from that settlement forward
- Trading Authorization for the program is automatically revoked
- Any new positions would be deemed unauthorized and transferred to the Asset Investment Management (AIM) error account immediately.
6) How incentive fees work (3 minutes 45 seconds)
- AIM Advisory & Risk Control Agreement
- 0.00% Front load
- 0.00% Management fee
- 12.50% Of net new high profits quarterly
- Net new highs (calculated after all brokerage, exchange and regulatory fees have been deducted including those on open positions)
- Quarterly incentive fees have to be approved by the client prior to be deducted from the account
If you have questions send us a message or schedule an online review to speak with a broker who’ll answer your questions and provide supporting links for additional information and/or verification.